
- Title
-
Wnt5b integrates Fak1a to mediate gastrulation cell movements via Rac1 and Cdc42
- Authors
- Hung, I.C., Chen, T.M., Lin, J.P., Tai, Y.L., Shen, T.L., Lee, S.J.
- Source
- Full text @ Open Biol.
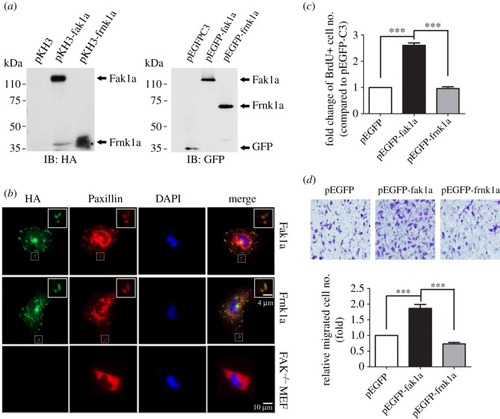
Zebrafish Fak1a is functionally conserved with mammalian FAKs. ( |
Zebrafish PHENOTYPE:
|
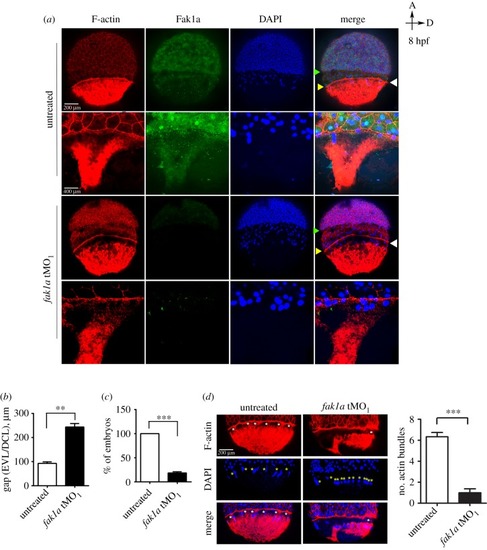
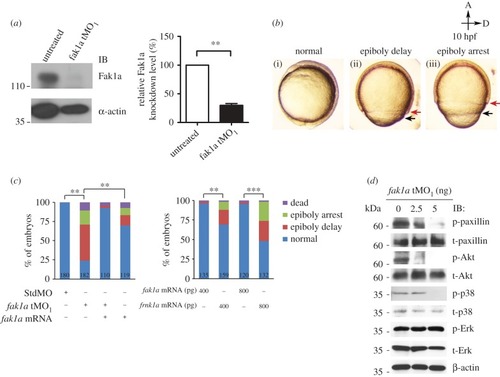
Loss of Fak1a perturbs the synchronized migration of enveloping and deep cell layers and the F-actin network. ( PHENOTYPE:
|
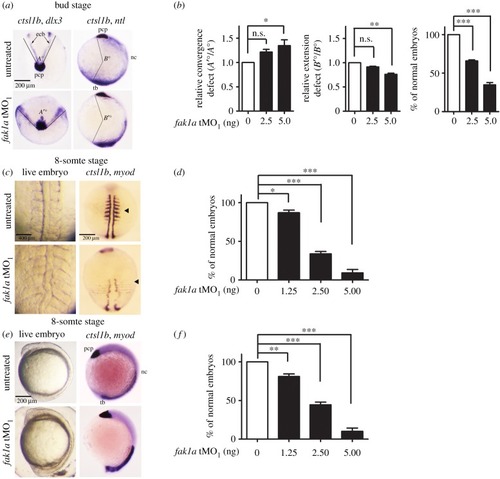
Loss of Fak1a causes EXPRESSION / LABELING:
PHENOTYPE:
|
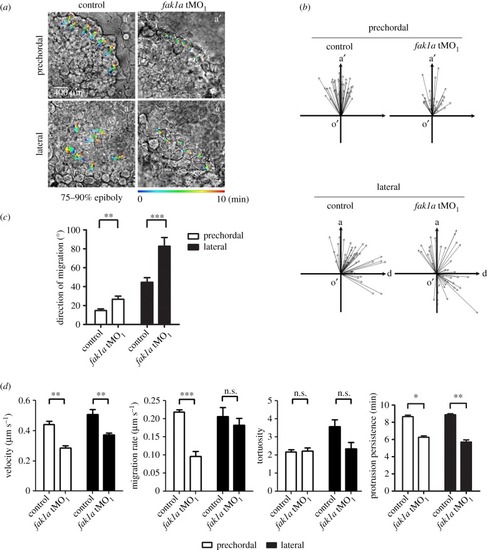
Loss of Fak1a perturbs hypoblast cell migration. Embryos were injected with 5 ng of a random control morpholino (MO) N-25 (control) or PHENOTYPE:
|
Fak1a functions non-cell-autonomously to regulate cell migration during gastrulation. ( |
Overexpression of |
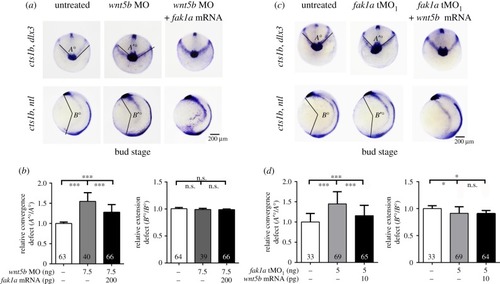
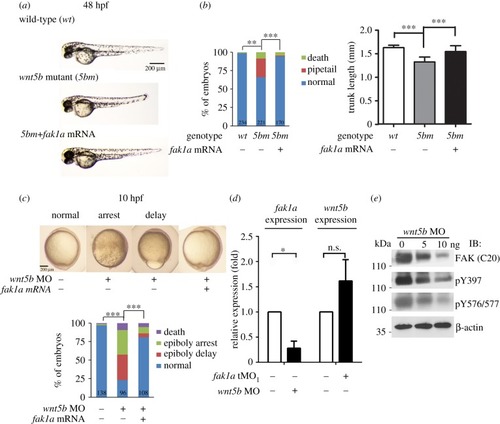
Fak1a and Wnt5b reciprocally rescue convergence defects in |
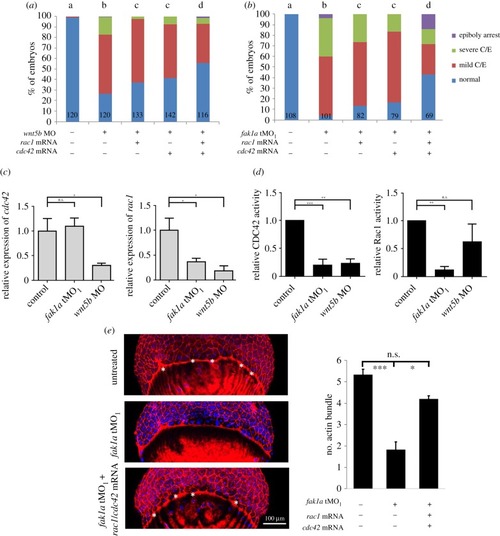
Wnt5b and Fak1a modulate Rac1 and Cdc42 to control cell migration during gastrulation. ( EXPRESSION / LABELING:
PHENOTYPE:
|
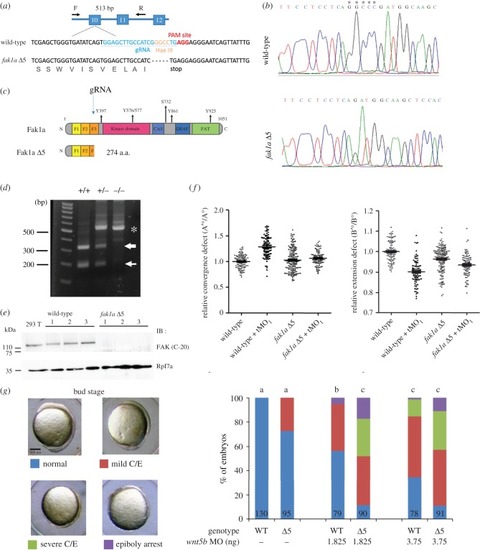
CRISPR/Cas9-mediated deletion of Fak1a results in mild gastrulation defects due to compensatory PHENOTYPE:
|
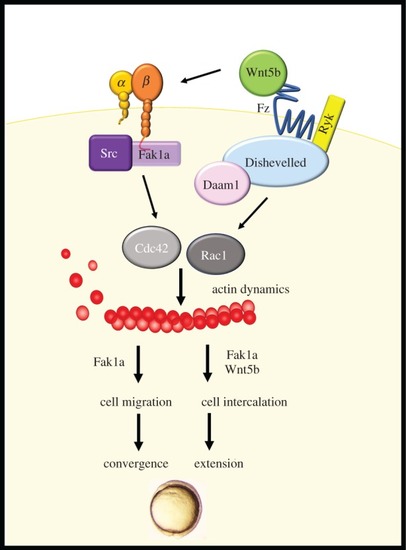
Wnt5b integrates with Fak1a to mediate cell movements during gastrulation. Gastrulation cell migration is controlled by the Wnt5b pathway to activate calcium and Dsh/Daam1. Herein, we identified that Wnt5b can also integrate with FAK signalling, and both Wnt5b and Fak1a then activate small GTPase Rac1 and Cdc42 to mediate actin dynamics during gastrulation. Convergent is mainly mediated by Fak1a-mediated cell migration and extension is exerted by cell intercalation, which requires both Fak1a and Wnt5b. |