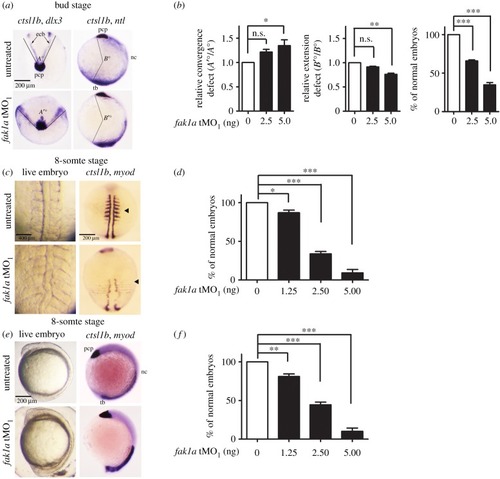
Loss of Fak1a causes abnormal convergence and extension movements. (a) Embryos injected with a designated amount of a fak1a translation blocking morpholino (tMO1) were subjected to WISH against indicated genes at the bud stage. Representative WISH staining photographs against ctsl1b/dlx3 or ctsl1b/ntl are presented for untreated and fak1a tMO1-treated embryos (fak1a tMO1). ctsl1b, dix3 and ntl staining were used to label the prechordal plate (pcp), ectodermal borders (ecb) and notochord (nt)/tail bud (tb), respectively. For simplicity, tissues are labelled in untreated embryos only. To reveal dorsal convergence, embryos were probed with ctsl1b/dlx3 as shown in the anterior view (left). A round prechordal plate is in the middle with two ectodermal borders forming a V-shape. Lines were drawn along the ectodermal borders that matched the prechordal plates. The V-shape formed an angle as indicated by A° and A′° in untreated and fak1a tMO1-treated embryos, respectively. To reveal the dorsal extension, embryos were probed with ctsl1b/ntl as shown in the lateral view with the dorsal to the right (right). Lines were drawn from the anterior front of the prechordal plate and the posterior end of the tail bud to the centre of the embryo forming an angle towards the dorsal as indicated by B° and B′° in untreated and fak1a tMO1-treated embryos, respectively. (b) The relative convergence and extension defects were quantified by calculating the ratios of A′°/A° (left panel) and B′°/B° (middle panel), respectively. The normality of anterolateral migration of the prechordal plate was examined by signals of ctsl1b and dlx3 in embryos injected with a designated amount of the fak1a tMO1 (right panel). n = 3, *p < 0.05, **p < 0.01, ***p < 0.001, n.s., not significant. (c) Embryos were injected with different amounts of the fak1a tMO1, cultured to the 8-somite stage, photographed (live embryo) or fixed, and subjected to WISH against ctsl1b/myo D. Representative dorsal view photographs are shown in (c), and statistical comparisons of embryos with normal somites are presented in (d). As described in (c,d), the anterior and posterior extensions of the dorsal axes were examined. Representative lateral-view photographs with the anterior to the left are shown in (e), and statistical comparisons of embryos with normal dorsal axis extension are presented in (f).
|
