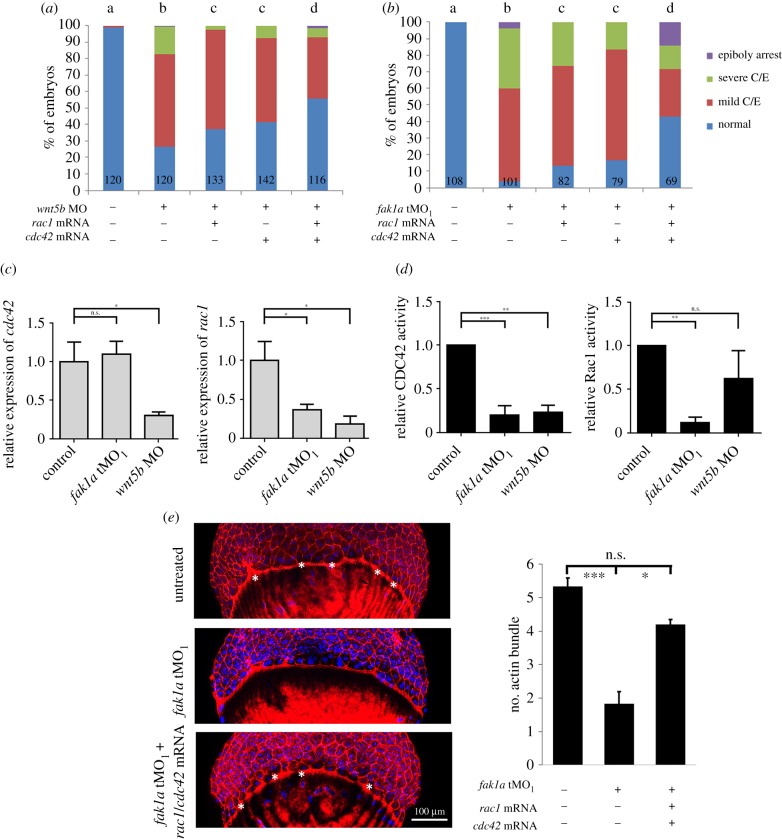
IMAGE

Figure 9.

ID
ZDB-IMAGE-200316-13
Genes
Source
Figures for Hung et al., 2020
Image
Figure Caption

Figure 9.

Wnt5b and Fak1a modulate Rac1 and Cdc42 to control cell migration during gastrulation. (a,b) Embryos were untreated or injected with 7.5 ng of the wnt5b MO, 5 ng of fak1a or 1.25 pg of rac1 and cdc42 mRNA. Embryos were cultured to the bud stage and classified into normal, mild/severe convergent extension (mild/severe C/E) defects, and epiboly arrest categories. The percentages of embryos in different categories are shown. Numbers of embryos observed are given at the bottom of each bar. n = 3. Values between groups with a significant difference (p < 0.05) are denoted by different letters. (c) Embryos injected with the wnt5b or fak1a MO were collected at the bud stage to measure the expression of cdc42 or rac1 by a qPCR, respectively. Ef1α served as an internal control. (d) Embryos were treated as in (c) and lysed to measure the activities of Cdc42 and Rac1 by an ELISA activity assay (n = 3, *p < 0.05). (e) Embryos were treated with fak1a MO with or without rac1 and cdc42 mRNA, stained and examined as described in figure 3d. The actin bundles between the actin ring and cap are indicated by asterisks. The numbers of actin bundles in each treatment were presented in the right bar graph (n = 3, *p < 0.05, ***p < 0.001).

Figure Data
Acknowledgments
This image is the copyrighted work of the attributed author or publisher, and ZFIN has permission only to display this image to its users. Additional permissions should be obtained from the applicable author or publisher of the image. Full text @ Open Biol.