IMAGE

Figure 6.

ID
ZDB-IMAGE-200316-10
Source
Figures for Hung et al., 2020
Image
Figure Caption

Figure 6.

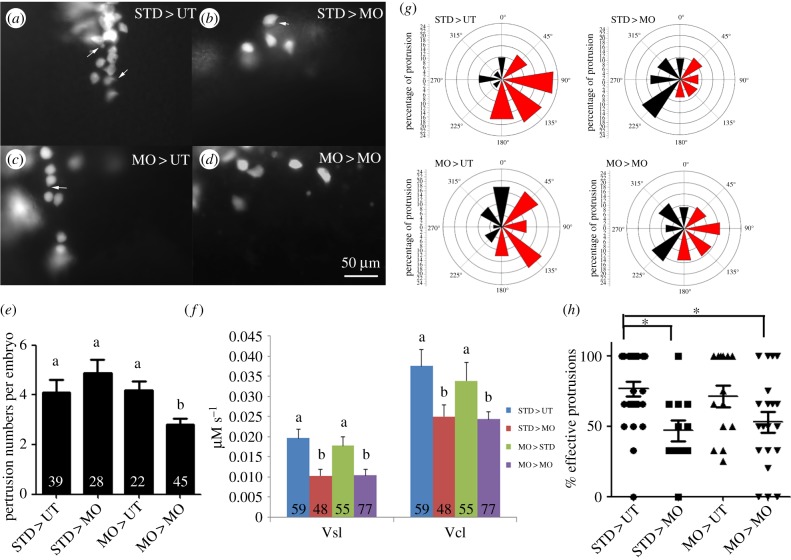
Fak1a functions non-cell-autonomously to regulate cell migration during gastrulation. (ad) Rhodamine-labelled blastomeres were transplanted from embryos injected with 5 ng of StdMO (Std) or tMO1 (MO) with rhodamine dextran to untreated hosts (UT) or tMO1 morphant hosts (MO). Host embryos were then imaged (animal pole on the top and vegetal pole at the bottom) under epifluorescence microscopy, recorded and representative snapshots are shown in (a) STD > UT: StdMO-treated cells in an untreated host. (b) STD > MO: StdMO-treated cells in a tMO1 morphant. (c) MO > UT: tMO1-treated cells in an untreated host. (d) MO > MO: tMO1-treated cells in a tMO1 morphant. Arrows indicate the representative cellular protrusions in each embryo. (e) The average protrusion numbers per embryo were counted from each recording and shown. The total number of embryos used for each treatment is shown on the bottom of each bar. Values between groups with a significant difference (p < 0.05) are denoted by different letters. (f) The transplanted cells were traced and their curvillinear velocity (Vcl) and strait line velocity (Vcl) were calculated and shown. Values between groups with a significant difference (p < 0.05) are denoted by different letters. (g) The distribution of protrusions formed from donor cells transplanted to host is shown. The centre of a cell is regarded as the centroid of the rose diagram. A rose diagram is divided into eight equally parts with designated angles. The 0°, 90° and 180° points to the animal pore, dorsal side and vegetal pore, respectively. The percentages of protrusion per cell were calculated and plotted on rose diagrams. The effective protrusions were marked in red and the ineffective ones are marked in dark. Y-axis for the rose diagrams represents the percentage of protrusions in each direction bin. (h) The percentage of effective protrusions per cell in each group were shown (n = 3, *p < 0.05).

Acknowledgments
This image is the copyrighted work of the attributed author or publisher, and ZFIN has permission only to display this image to its users. Additional permissions should be obtained from the applicable author or publisher of the image. Full text @ Open Biol.