IMAGE

Figure 5.

ID
ZDB-IMAGE-200316-9
Source
Figures for Hung et al., 2020
Image
Figure Caption

Figure 5.

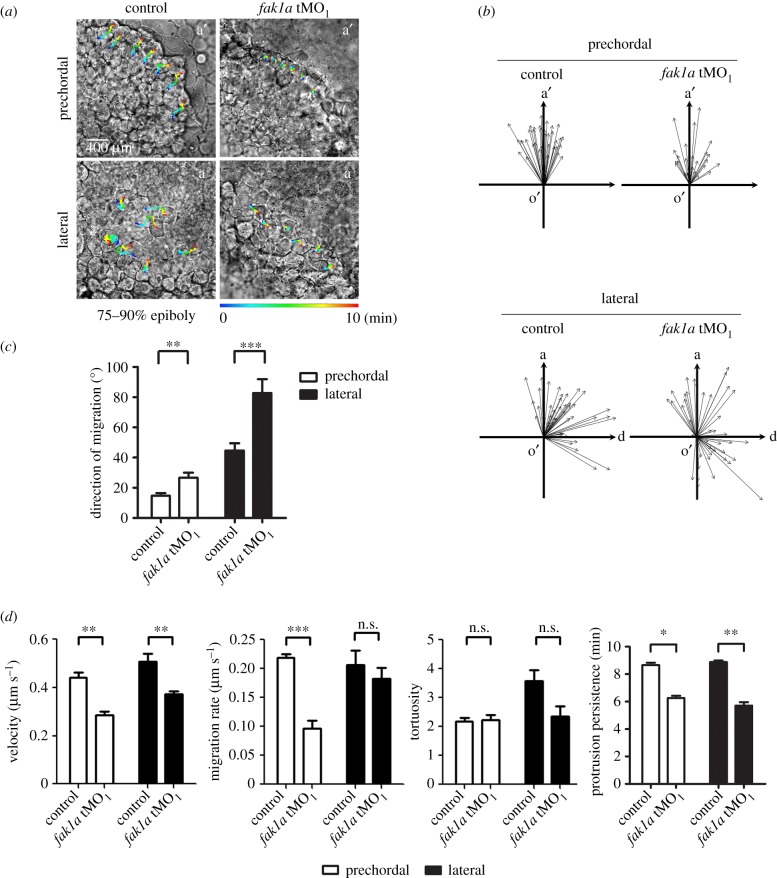
Loss of Fak1a perturbs hypoblast cell migration. Embryos were injected with 5 ng of a random control morpholino (MO) N-25 (control) or fak1a translation blocking MO (tMO1), immobilized and monitored under differential interference microscopy. Time-lapse movies were taken for 10 min during the 75–90% epiboly stage to reveal the involuting cell migration of the anterior prechordal plate or convergent movement of lateral cells (see electronic supplementary material, movies S1–S4). (a) Representative snapshots of the prechordal plate or lateral cells at the end of representative recordings are shown. More than six cells were selected from an embryo to be traced in each movie, and their migrating routes are depicted by a rainbow line representing the recording time at 0–10 min. a′, anterior; a, animal pole. These experiments were repeated at least three times. (b) The moving direction (arrow direction) and migration distance (arrow length) of each traced cell are represented by an arrow. The origin (o′) of the coordinate plane stands for the starting point of each cell. a′, anterior; a, animal pole; d, dorsal side. (c) The polarity of each cell was measured as described in Results, and the analysis showed a significant loss in the polarity of the prechordal and lateral cell migration in fak1a tMO1-treated embryos (n ≥ 3; n ≥ 36). (d) The migration velocity, migration rate, tortuosity (route/distance) and protrusion persistence of each recording were analysed with Simple PCI software, and comparisons between groups are shown. n.s., not significant, *p < 0.05; **p < 0.01, ***p < 0.001.

Figure Data
Acknowledgments
This image is the copyrighted work of the attributed author or publisher, and ZFIN has permission only to display this image to its users. Additional permissions should be obtained from the applicable author or publisher of the image. Full text @ Open Biol.