- Title
-
Rap1b Promotes Notch-Signal-Mediated Hematopoietic Stem Cell Development by Enhancing Integrin-Mediated Cell Adhesion
- Authors
- Rho, S.S., Kobayashi, I., Oguri-Nakamura, E., Ando, K., Fujiwara, M., Kamimura, N., Hirata, H., Iida, A., Iwai, Y., Mochizuki, N., Fukuhara, S.
- Source
- Full text @ Dev. Cell
|
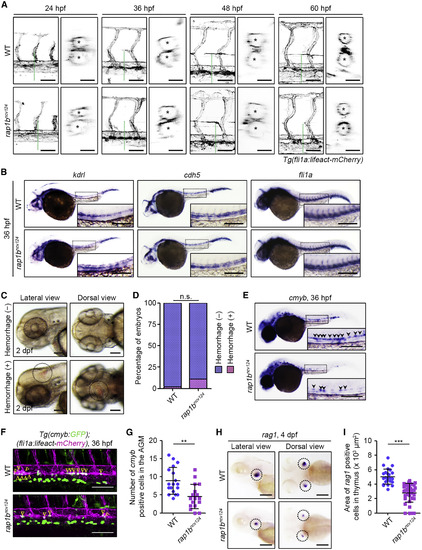
Rap1b Is Not Essential for Vascular Development and Integrity but Is Required for HSC Development (A) Confocal stack fluorescence images of trunk vasculature in sibling (WT; upper) and rap1bncv124 (lower) embryos and larvae at 24, 36, 48, and 60 hpf with the Tg(fli1a:lifeact-mCherry) background. Lateral views with anterior to the left. The cross-sectional images of the area indicated by dotted green lines on the images are shown on the right side. Asterisks indicate lumens of DA (upper) and posterior cardinal vein (lower). (B) Expression patterns of endothelial marker genes kdrl (left column), cdh5 (middle column), and fli1a (right column) in sibling (WT; upper) and rap1bncv124 (lower) embryos at 36 hpf. (C) Representative bright field images of the heads of 2 dpf rap1bncv124embryos without (upper panels) or with (lower panels) intracranial hemorrhage. Lateral and dorsal view images are shown in the left and right columns, respectively. Dotted circles indicate the region of cranial hemorrhage. (D) Quantification of intracranial hemorrhage in sibling (WT) and rap1bncv124 embryos at 2 dpf. Percentages of normal embryos (blue) and those showing intracranial hemorrhage (pink). WT, n = 69; rap1bncv124, n = 88. n.s., not significant. (E) Expression patterns of the HSC marker cmyb in 36 hpf sibling (WT) and rap1bncv124 embryos. Arrowheads indicate cmyb-positive HSCs. (F) Confocal stack fluorescence images of trunk axial vasculature in 36 hpf sibling (WT; upper) and rap1bncv124 (lower) embryos with the Tg(cmyb:GFP);(fli1a:lifeact-mCherry) background. Lateral views with anterior to the left. Merged images of cmyb:GFP (green) and fli1a:lifeact-mCherry (magenta). Arrowheads indicate cmyb:GFP- and fli1a:lifeact-mCherry double-positive HSCs located in the ventral side of the DA. (G) Number of cmyb:GFP- and fli1a:lifeact-mCherry double-positive HSCs in the aorta-gonad-mesonephros (AGM) regions of 36 hpf sibling (WT) and rap1bncv124 embryos, as observed in (F). Each dot represents an individual embryo. Error bars indicate means ± SD. WT, n = 18; rap1bncv124, n = 17. ∗∗p < 0.01. (H) Expression patterns of the lymphoid lineage marker rag1 in the 4 dpf sibling (WT) and rap1bncv124 embryos. Lateral (left column) and dorsal (right column) views with anterior to the left. Dotted circles indicate the region of the thymus. (I) Quantification of the rag1-positive thymus area in the 4 dpf sibling (WT) and rap1bncv124 embryos, as observed in (H). Each dot represents an individual thymus. Error bars indicate means ± SD. WT, n = 12; rap1bncv124, n = 19. ∗∗∗p < 0.001. In (B) and (E), boxed areas are enlarged in the insets. Scale bars: 50 μm (lateral view in A); 20 μm (cross-sectional image in A); 200 μm (B, C, E, and H); 100 μm (F). |
|
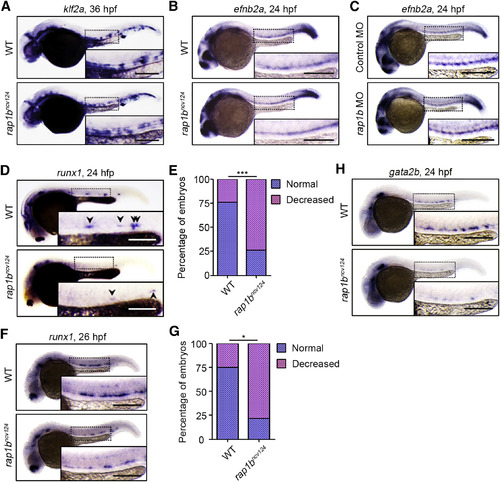
Rap1b Is Involved in HE Specification (A) Expression patterns of blood-flow-responsive gene klf2a in 36 hpf sibling (WT) and rap1bncv124 embryos. (B and C) Expression patterns of arterial marker efnb2a in 24 hpf sibling (WT) and rap1bncv124 embryos (B) and in 24 hpf embryos injected with control MO or rap1b MO (C). (D) Expression patterns of HE marker runx1 in 24 hpf sibling (WT) and rap1bncv124 embryos. Arrowheads indicate runx1-positive hemogenic ECs. (E) Percentage of embryos showing normal (3 or more, blue) and decreased (less than 3, pink) numbers of runx1-positive hemogenic ECs in the AGM regions, as observed in (D). WT, n = 42; rap1bncv124, n = 43. ∗∗∗p < 0.001. (F) Expression patterns of runx1 in 26 hpf sibling (WT) and rap1bncv124embryos. (G) Percentages of embryos showing normal (blue) and decreased (pink) expression of runx1 in the AGM regions, as observed in (F). WT, n = 12; rap1bncv124, n = 10. ∗p < 0.001. (H) Expression patterns of another HE marker, gata2b, in 24 hpf sibling (WT) and rap1bncv124 embryos. In (A)–(D), (F), and (H), boxed areas are enlarged in the insets. Scale bars: 200 μm (A–D, F, and H) |
|
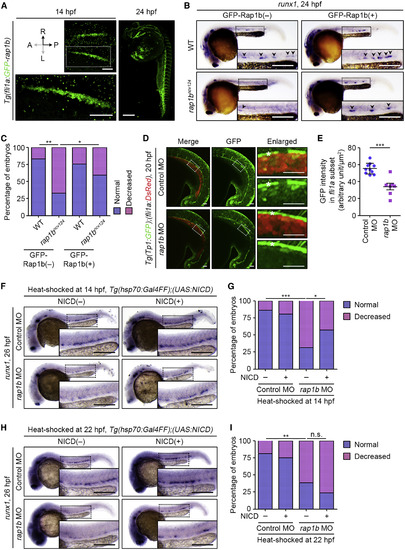
Rap1b Cell-Autonomously Regulates HE Specification through Notch Signaling (A) Confocal stack images of Tg(fli1a:GFP-rap1b) embryos at 14 (left) and 24 (right) hpf. Left, dorsal views with anterior to the left. Boxed area is enlarged at the bottom. Right, lateral view with anterior to the top. GFP-Rap1b is expressed in lateral plate mesoderm at 14 hpf and in blood vessels at 24 hpf. (B) Expression patterns of runx1 in 24 hpf sibling (WT, upper) and rap1bncv124 (lower) embryos crossed without (GFP-Rap1b(‒), left column) or with (GFP-Rap1b(+), right column) Tg(fli1a:GFP-rap1b). Arrowheads indicate runx1-positive hemogenic ECs. (C) Percentages of embryos showing normal (3 or more, blue) and decreased (less than 3, pink) numbers of runx1-positive hemogenic ECs in the AGM regions, as observed in (B). WT+GFP-Rap1b(‒), n = 31; rap1bncv124+GFP-Rap1b(‒), n = 28; WT+GFP-Rap1b(+), n = 23; rap1bncv124+GFP-Rap1b(‒), n = 27. ∗∗p < 0.01; ∗p < 0.05. (D) Confocal stack fluorescence images of trunk and tail regions of 20 hpf Tg(Tp1:GFP);(fli1a:DsRed) embryos injected with control MO (upper) and rap1b MO (lower). Left, merged images of GFP (green) and DsRed (red); middle, GFP images; right, enlarged merged (upper) and GFP (lower) images of boxed areas. Asterisks indicate notochord-derived Tp1:GFP signal. (E) Relative fluorescence intensity of Tp1:GFP in the DsRed-labeled vascular cord, as observed in (D). Each dot represents an individual embryo. Error bars indicate means ± SD. Control MO, n = 10; rap1b MO, n = 7. ∗∗∗p < 0.001. (F and H) Expression patterns of runx1 in 26 hpf control MO- and rap1bMO-injected embryos heat shocked at 14 hpf (F) and 22 hpf (H) for 45 min with either wild type or the Tg(hsp70:Gal4FF) background (NICD(‒), left column) and with the Tg(hsp70:Gal4FF);(UAS:NICD)background (NICD(+), right column). (G and I) Percentages of embryos showing normal (blue) and decreased (pink) expressions of runx1 in the AGM regions of embryos heat shocked at 14 hpf (G) and 22 hpf (I), as observed in (F) and (H). (G) Control MO/NICD(‒), n = 22; rap1b MO/NICD(‒), n = 32; Control MO/NICD(+), n = 26; rap1b MO/NICD(+), n = 28. (I) Control MO/NICD(‒), n = 32; rap1b MO/NICD(‒), n = 26; Control MO/NICD(+), n = 20; rap1bMO/NICD(+), n = 17. ∗p < 0.05; ∗∗p < 0.01; ∗∗∗p < 0.001; n.s., not significant. In (B), (F), and (H), boxed areas are enlarged in the insets. Scale bars: 200 μm (A, B, F, and H); 50 μm (D). EXPRESSION / LABELING:
PHENOTYPE:
|
|
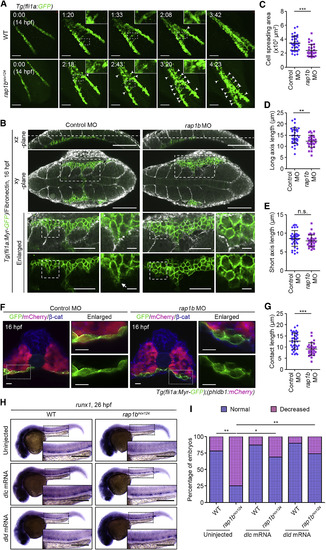
Rap1b Promotes PLPM Cell Adhesion to Somitic Cells to Regulate HE Specification (A) Confocal stack fluorescence images of PLPM cell migration in sibling (WT, upper) and rap1bncv124 (lower) Tg(fli1a:GFP) embryos at 14 hpf and the corresponding subsequent time-lapse images, obtained at the indicated time points (h:min). Dorsal views with anterior to the upper-left. Arrowheads indicate the cells that remained behind the group of migrating cells. (B) Confocal fluorescence images of 16 hpf sibling (WT, left) and rap1bncv124 (right) Tg(Myr-fli1a:GFP) embryos immunostained with anti-GFP and anti-Fn antibodies. Merged images of GFP (green) and Fn (white) in the xz-plane (lateral view with anterior to the left) and xy-plane (dorsal view with anterior to the left) are shown in the first and second rows, respectively. Dotted lines on the xz-planes indicate the position of the corresponding xy-planes. The boxed areas in the xy-planes are enlarged at the third (merged images) and fourth (GFP images) rows. The boxed areas in the enlarged images are further enlarged at the right. Arrow indicates membrane protrusion at the leading edge. Note that PLPM cells migrate along somite boundaries labeled by Fn staining. (C–E) Morphology of PLPM cells migrating along the somite boundaries, as observed in (B). Cell spreading areas (C), cell length relative to the direction of cell migration (D), and cell length perpendicular to the direction of cell migration (E). Each dot represents an individual cell. Error bars indicate means ± SD. Control MO, n = 39; rap1b MO, n = 30. ∗∗p < 0.01; ∗∗∗p < 0.001; n.s., not significant. (F) Confocal fluorescence images of transverse sections in the posterior region of 16 hpf control MO- and rap1b MO-injected Tg(fli1a:Myr-GFP);(phldb1:mCherry) embryos immunostained with anti-GFP (green), anti-mCherry (red), and anti-β-catenin (blue) antibodies. Left, the merged images of GFP, mCherry, and β-catenin; right, enlarged merged images (upper) and enlarged GFP images (lower) corresponding to the boxed areas. (G) Contact length of PLPM cells with somitic cells in the control MO- and rap1b MO-injected embryos, as observed in (F). Each dot represents an individual cell. Error bars indicate means ± SD. Control MO, n = 39; rap1b MO, n = 30. ∗∗∗p < 0.001. (H) Expression patterns of runx1 in 26 hpf sibling (WT, left) and rap1bncv124 (right) embryos injected without (upper) or with dlc mRNA (middle) or dld mRNA (bottom). (I) Percentage of embryos showing normal (blue) and decreased (pink) expression of runx1 in the AGM regions, as observed in (H). Uninjected WT, n = 18; Uninjected rap1bncv124, n = 16; dlc mRNA-injected WT, n = 15; dlc mRNA-injected rap1bncv124, n = 13; dld mRNA-injected WT, n = 10; dld mRNA-injected rap1bncv124, n = 19. ∗p < 0.05; ∗∗p < 0.01. In (A) and (H), boxed areas are enlarged in the insets. Scale bars: 100 μm (A and B); 50 μm (left enlarged images in B); 10 μm (right enlarged images in B and F); 200 μm (H). EXPRESSION / LABELING:
PHENOTYPE:
|
|
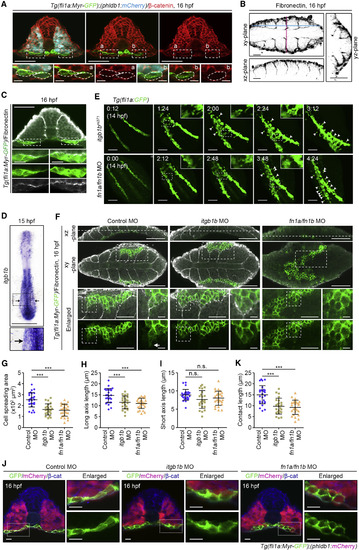
Itgb1b-Mediated Adhesion to Fn Promotes PLPM Cell Contact with Somitic Cells (A) Confocal fluorescence images of transverse sections in the posterior regions of 16 hpf Tg(fli1a:Myr-GFP);(phldb1:mCherry) embryos immunostained with anti-GFP (green), anti-mCherry (blue), and anti-β-catenin (red) antibodies. Left, merged image of GFP, mCherry, and β-catenin; middle, merged image of GFP and β-catenin; right, β-catenin image. Boxed areas labeled with a and b are enlarged at the bottom. (B) Confocal fluorescence images of 16 hpf WT embryos immunostained with anti-Fn antibody. Fn images in the xy-, xz-, and yz-planes. Blue and pink dotted lines on the xy-plane indicate the position of the corresponding xz- and yz-planes, respectively. (C) Confocal fluorescence images of transverse sections in the posterior regions of 16 hpf Tg(fli1a:Myr-GFP) embryos immunostained with anti-GFP (green) and anti-Fn (white) antibodies. The merged images of GFP and Fn, GFP image, and Fn image corresponding to the boxed areas are enlarged at the second, third, and fourth rows, respectively. (D) Expression pattern of itgb1b in the WT embryos at 15 hpf. Dorsal view of flat-mounted embryo with anterior to the top. The boxed area is enlarged below. Arrows indicate PLPM. (E) Confocal stack fluorescence images of PLPM cell migration in itgb1bmi371 mutant (upper) and fn1a/fn1b morphant (lower) with the Tg(fli1a:GFP) background at 14 hpf and their corresponding subsequent time-lapse images, obtained at the indicated time points (h:min). Dorsal views with anterior to the upper-left. Boxed areas are enlarged in the insets. Arrowheads indicate the cells that remained behind the group of migrating cells. (F) Confocal fluorescence images of 16 hpf control MO-, itgb1b MO-, and fn1a/fn1b MO-injected Tg(Myr-fli1a:GFP) embryos immunostained with anti-GFP (green) and anti-Fn (white) antibodies are shown as in Figure 4B. (G–I) Morphology of PLPM cells migrating along the somiteboundaries, as observed in (F). Cell spreading areas (G), cell length relative to the direction of cell migration (H), and cell length perpendicular to the direction of cell migration (I). Each dot represents an individual cell. Error bars indicate means ± SD. Control MO, n = 27; itgb1b MO, n = 24; fn1a/fn1b MO, n = 27. ∗∗∗p < 0.001; n.s., not significant. (J) Confocal fluorescence images of transverse sections in the posterior region of 16 hpf control MO-, itgb1b MO-, and fn1a/fn1b MO-injected Tg(fli1a:Myr-GFP);(phldb1:mCherry) embryos immunostained with anti-GFP (green), anti-mCherry (magenta), and anti-β-catenin (blue) antibodies. Left, the merged images of GFP, mCherry, and β-catenin; right, enlarged merged images (upper) and enlarged GFP images (lower) corresponding to the boxed areas. (K) Contact length of PLPM cells with somitic cells in the embryos injected with control MO, itgb1b MO, and fn1a/fn1b MO, as observed in (J). Each dot represents an individual cell. Error bars indicate means ± SD. Control MO, n = 27; itgb1b MO, n = 24; fn1a/fn1b MO, n = 27. ∗∗∗p < 0.001. Scale bars: 50 μm (A and C, enlarged images in F (left)); 10 μm (enlarged images in A, C, and F (right), J); 25 μm (B); 200 μm (D); 100 μm (E and F). EXPRESSION / LABELING:
PHENOTYPE:
|
|
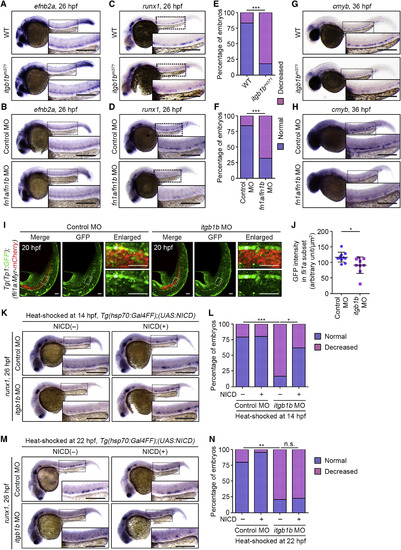
Itgb1b-Mediated Adhesion to Fn Regulates HE Specification (A) Expression patterns of efnb2a in 26 hpf sibling (WT) and itgb1bmi371embryos. (B) Expression patterns of efnb2a in 26 hpf control MO- and fn1a/fn1bMO-injected embryos. (C) Expression patterns of runx1 in 26 hpf sibling (WT) and itgb1bmi371embryos. (D) Expression patterns of runx1 in 26 hpf control MO- and fn1a/fn1bMO-injected embryos. (E) Percentages of embryos showing normal (blue) and decreased (pink) expressions of runx1 in the AGM regions, as observed in (C). WT, n = 12; itgb1bmi371, n = 11. ∗∗∗p < 0.001. (F) Percentages of embryos showing normal (blue) and decreased (pink) expressions of runx1 in the AGM regions, as observed in (D). Control MO, n = 31; fn1a/fn1b MO, n = 25. ∗∗∗p < 0.001. (G and H) Expression patterns of cmyb in 36 hpf sibling (WT) and itgb1bmi371 embryos (G) and in 36 hpf control MO- and fn1a/fn1b MO-injected embryos (H). (I) Confocal stack fluorescence images of trunk and tail regions of 20 hpf Tg(Tp1:GFP);(fli1a:Myr-mCherry) embryos injected with control MO (left) and itgb1b MO (right). Left, merged images of GFP (green) and mCherry (red); middle, GFP images; right, enlarged merged (upper) and GFP (lower) images of the boxed areas. Asterisks indicate notochord-derived Tp1:GFP signal. (J) Relative fluorescence intensity of Tp1:GFP in the fli1a:Myr-mCherry-labeled vascular cord, as observed in (I). Each dot represents an individual embryo. Error bars indicate means ± SD. Control MO, n = 11; itgb1b MO, n = 9. ∗p < 0.05. (K and M) Expression patterns of runx1 in 26 hpf control MO- and itgb1b MO-injected embryos heat shocked at 14 hpf (K) and 22 hpf (M) for 45 min with either WT or the Tg(hsp70:Gal4FF) background (NICD(‒), left column) and with the Tg(hsp70:Gal4FF);(UAS:NICD)background (NICD(+), right column). (L and N) Percentages of embryos showing normal (blue) and decreased (pink) expressions of runx1 in the AGM regions of embryos heat shocked at 14 hpf (L) and 22 hpf (N), as observed in (K) and (M). (L) Control MO/NICD(‒), n = 26; itgb1b MO/NICD(‒), n = 20; Control MO/NICD(+), n = 22; itgb1b MO/NICD(+), n = 22. (N) Control MO/NICD(‒), n = 33; itgb1b MO/NICD(‒), n = 29; Control MO/NICD(+), n = 13; itgb1b MO/NICD(+), n = 15. ∗p < 0.05; ∗∗p < 0.01; ∗∗∗p < 0.001; n.s., not significant. In (A)–(D), (G), (H), (K), and (M), boxed areas are enlarged in the insets. Scale bars: 200 μm (A–D, G, H, K, and M); 50 μm (I). EXPRESSION / LABELING:
PHENOTYPE:
|
|
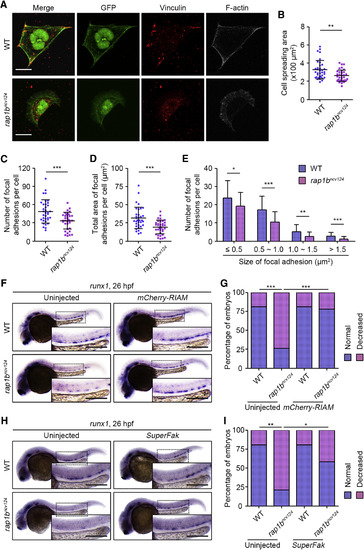
Rap1b Regulates HE Specification through Promotion of Itgb1b-Mediated Adhesion of PLPM Cells (A) Cells dissociated from 17 hpf WT (upper) and rap1bncv124 (lower) Tg(fli1a:GFP) embryos. Merged images of GFP (green) and vinculin (red), GFP (green), vinculin (red), and F-actin (gray) images are shown as indicated. (B) Spreading areas of GFP-positive cells derived from WT and rap1bncv124 embryos, as observed in (A). (C) Number of vinculin-marked focal adhesions per cell, as observed in (A). (D) Total area of vinculin-marked focal adhesions per cell, as observed in (A). (E) Number of vinculin-marked focal adhesions, as observed in (A). Data are shown as mean ± SD. In (B)–(D), each dot represents an individual cell. Error bars indicate means ± SD. In (B)–(E), WT, n = 35; rap1bncv124, n = 35. ∗p < 0.05; ∗∗p < 0.01; ∗∗∗p < 0.001. (F) Expression patterns of runx1 in 26 hpf sibling (WT, left) and rap1bncv124 (right) embryos injected without (left) or with mCherry-RIAMmRNA (right). (G) Percentages of embryos showing normal (blue) and decreased (pink) expressions of runx1 in the AGM regions, as observed in (F). Uninjected WT, n = 17; Uninjected rap1bncv124, n = 16; mCherry-RIAM mRNA-injected WT, n = 20; mCherry-RIAM mRNA-injected rap1bncv124, n = 14. ∗∗∗p < 0.001. (H) Expression patterns of runx1 in 26 hpf sibling (WT, left) and rap1bncv124 (right) embryos injected without (left) or with SuperFak mRNA (right). (I) Percentages of embryos showing normal (blue) and decreased (pink) expressions of runx1 in the AGM regions, as observed in (H). Uninjected WT, n = 15; Uninjected rap1bncv124, n = 14; SuperFak mRNA-injected WT, n = 15; SuperFak mRNA-injected rap1bncv124, n = 16. ∗p < 0.05; ∗∗p < 0.01. In (F) and (H), boxed areas are enlarged in the insets. Scale bars: 10 μm (A); 200 μm (F and H). |
|
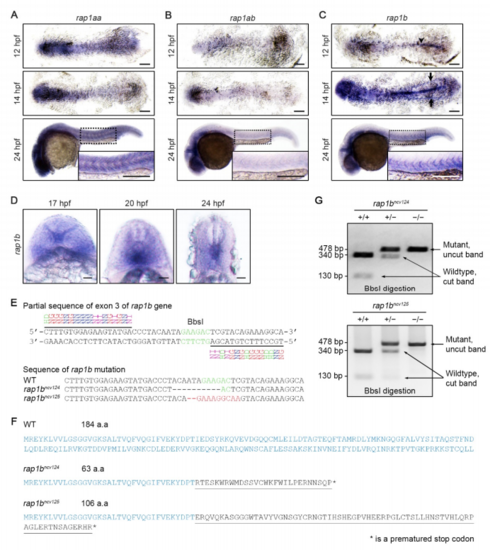
Expression Patterns of rap1aa, rap1ab, and rap1b in Zebrafish Embryos and Generation of rap1b Mutant Zebrafish Lines, Related to Figure 1. (A-C) Expression patterns of rap1aa (A), rap1ab (B) and rap1b (C) in the wild type embryos at 12 (upper), 14 (middle) and 24 (bottom) hpf. Upper and middle panels, dorsal views of flat-mounted embryos with anterior to the left; bottom panels, lateral views with anterior to the left. The boxed areas are enlarged in the insets. Arrowhead and arrows indicate notochord and posterior lateral plate mesoderm, respectively. Scale 3 bars: 200 μm. (D) Expression patterns of rap1b in the posterior regions of wild type embryos at 17, 20, 24 hpf. Transverse images with dorsal to the top. Scale bars: 20 μm. (E) Upper, partial sequence of exon3 of the rap1b gene, showing the TALEN binding sites (underlined) and the spacer DNA containing the BbsI restriction site. Lower, partial sequences of exon3 of the rap1b gene in wild type and rap1bncv124 and rap1bncv125 mutants. The rap1bncv124 mutant carries a 10-bp deletion, while rap1bncv125 mutant has a 11-bp deletion and a 9-bp insertion. (F) Amino acid sequences encoded by wild type and the mutated rap1b genes. Mutated alleles in rap1bncv124 and rap1bncv125 encode 28 and 69 mutated amino acids (underlined) from Ile36, followed by premature stop codons (asterisks), respectively. (G) Genotype of wild type allele (+/+) and heterozygous (+/‒) and homozygous (‒/‒) alleles of rap1bncv124 (left) and rap1bncv125 (right) mutants as confirmed by digestion of PCR products containing a BbsI site as indicated in (E). EXPRESSION / LABELING:
|
|
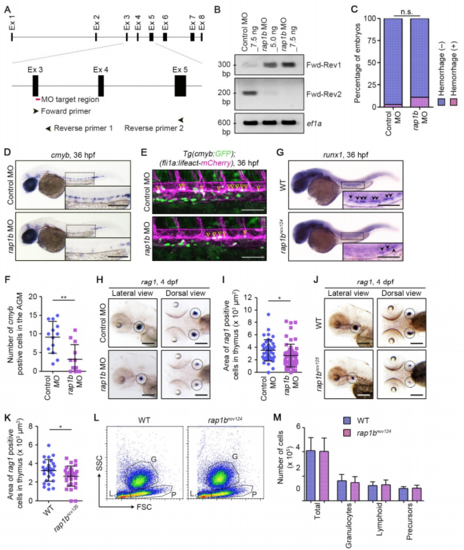
Rap1b Is Involved in HSC Development, Related to Figure 1. (A) Schematic representation of the rap1b gene. Target site of rap1b MO is indicated by red line. PCR primers used for RT-PCR (Forward primer (Fwd), Reverse primer 1 (Rev1), Reverse primer 2 (Rev2)) recognize the sites indicated by arrowheads. (B) RT-PCR analyses of RNAs extracted from the zebrafish embryos injected with 7.5 ng control MO, 5.0 ng rap1b MO or 7.5 ng rap1b MO were performed using two sets of PCR primers (Primer set 1, Fwd-Rev1; Primer set 2, Fwd-Rev2) as indicated in (A) and 5 control PCR primer (ef1a). PCR using Primer set 1 yielded the 305-bp fragment that contains partial sequence of exon 3 and intron 3 only in rap1b MO-injected embryos. In contrast, PCR using Primer set 2 amplified the 206-bp fragment corresponding to normally-spliced rap1b mRNA in control MO-injected embryos, but not in those injected with rap1b MO. (C) Quantification of intracranial hemorrhage in the 7.5 ng control MO- or rap1b MO-injected embryos at 2 dpf. Percentages of normal embryos (blue) and those showing intracranial hemorrhage (pink). Control MO, n=69; rap1b MO, n=68. n.s., not significant. (D) Expression patterns of the HSC marker cmyb in 36 hpf embryos injected with control MO (upper) or rap1b MO (lower). (E) Confocal stack fluorescence images of trunk axial vasculature in 36 hpf embryos injected with control MO (upper) or rap1b MO (lower) in the background of Tg(cmyb:GFP);(fli1a:Myr-mCherry). Lateral views with anterior to the left. Merged images of cmyb:GFP (green) and fli1a:Myr-mCherry (magenta). Arrowheads indicate cmyb:GFP- and fli1a:Myr-mCherry-double positive HSCs located in the ventral side of DA. (F) Number of cmyb:GFP- and fli1a:Myr-mCherry-double positive HSCs in the AGM regions of 36 hpf embryos injected with control MO or rap1b MO in the background of Tg(cmyb:GFP);(fli1a:lifeact-mCherry), as observed in (E). Each dot represents the value of individual embryos. Error bars indicate means ± s.d. Control MO, n=13; rap1b MO, n=13. **, p < 0.01. (G) Expression patterns of HSC marker runx1 in 36 hpf sibling (WT) and rap1bncv124 embryos. Arrowheads indicate runx1-positive HSCs. (H, J) Expression patterns of the lymphoid lineage marker rag1 in the 4 dpf larvae injected with control MO (upper) or rap1b MO (lower) (H) and in the 4 dpf sibling (WT) and rap1bncv125 embryos (J). Lateral (left column) and dorsal (right column) views with anterior to the left. Dotted circles indicate the region of thymus. (I, K) Quantification of the rag1-positive thymus area in the 4 dpf larvae injected with control MO or rap1b MO (I) and in the 4 dpf sibling (WT) and rap1bncv125 embryos (K), as observed in (H, J). Each dot represents the value of individual thymus. Error bars indicate means ± s.d. (I) Control MO, n=23; rap1b MO, n=31. (K) WT, n=14; rap1bncv125, n=16. *, p < 0.05. (L) Representative results of flow cytometric analysis of kidney marrow cells from wild type and rap1bncv124 embryos at 2-3 months of age. G, granulocyte population; L, lymphocyte population; P, precursor cell population. (M) Number of total and each hematopoietic cell population in the kidney marrow from wild type and rap1bncv124 embryos, as observed in (L). In (D) and (G), the boxed areas are enlarged in the insets. Scale bars: 200 μm (D, G, H, J); 100 μm (F). |
|
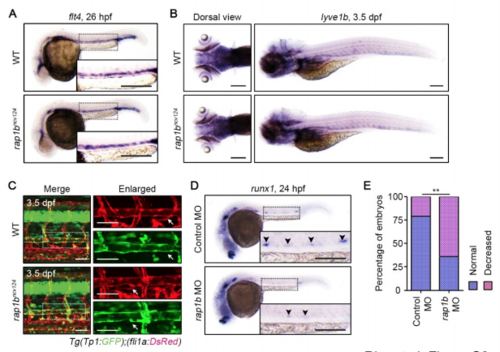
Rap1b Is Required for HE Specification but Dispensable for Specification of Venous and Lymphatic ECs, Related to Figure2. (A) Expression patterns of the venous marker flt4 in 26 hpf wild type and rap1bncv124 embryos. (B) Expression patterns of the lympathic EC marker lyve1b in 3.5 dpf wild type and rap1bncv124 embryos. Dorsal (left) and lateral (right) views with anterior to the left. (C) Confocal stack fluorescence images of trunk axial vasculature in 3.5 dpf sibling (WT; upper) and rap1bncv124 (lower) larvae in the background of Tg(Tp1:GFP);(fli1a:DsRed). Lateral views with anterior to the left. Merged images of Tp1:GFP (green) and fli1a:DsRed (red). Enlarged images of fli1a:DsRed and Tp1:GFP corresponding to the boxed areas are shown at the right. Arrows indicate thoracic duct. (D) Expression patterns of HE marker runx1 in 24 hpf embryos injected with control MO (upper) and rap1b MO (lower). Arrowheads indicate runx1-positive hemogenic ECs. (E) Percentage of embryos showing normal (3 or more, blue) and decreased (less than 3, pink) number of runx1-positive hemogenic ECs in the AGM regions as observed in D. Control MO, n=35; rap1b MO, n=51. **, p < 0.01. In (A), (C) and (D), the boxed areas are enlarged in the insets. Scale bars: 200 μm (A, B, D); 50 μm (C) |
|
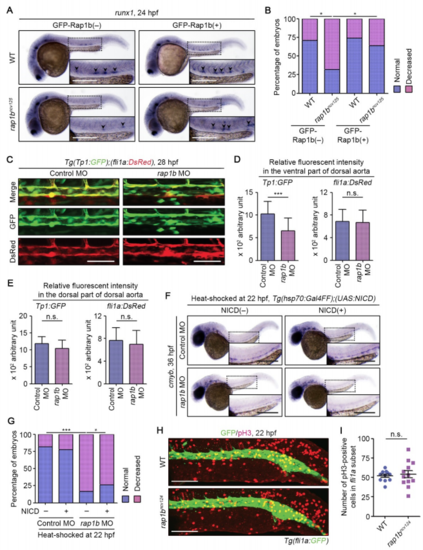
Rap1b Regulates HE Specification through Notch Signaling in a Cell-Autonomous Manner, Related to Figure 3. (A) Expression patterns of HE marker runx1 in 24 hpf sibling (WT, upper) and rap1bncv125 (lower) embryos crossed without (GFP-Rap1b(‒), left column) or with (GFP-Rap1b(+), right column) Tg(fli1a:GFP-rap1b). The boxed areas are enlarged in 9 the insets. Arrowheads indicate runx1-positive hemogenic ECs. (B) Percentage of embryos showing normal (3 or more, blue) and decreased (less than 3, pink) number of runx1-positive hemogenic ECs in the AGM regions as observed in (A). WT+GFP-Rap1b(‒), n=21; rap1bncv125+GFP-Rap1b(‒), n=25; WT+GFP-Rap1b(+), n=24; rap1bncv125+GFP-Rap1b(+), n=26. **, p < 0.01; *, p < 0.05. (C) Confocal stack fluorescence images of dorsal aorta in 28 hpf Tg(Tp1:GFP);(fli1a:DsRed) embryos injected with control MO (left column) and rap1b MO (right column). Dorsal view with anterior to the left. Upper, merged images of GFP (green) and DsRed (red); middle, GFP images; lower, DsRed images. (D, E) Relative fluorescence intensity of Tp1:GFP (left graph) and fli1a:DsRed (right graph) in the ventral (D) and dorsal (E) parts of dorsal aorta, as observed in (C). Data are means ± s.d. Control MO, n=16; rap1b MO, n=16. ***, p < 0.001; n.s., not significant. (F) Expression patterns of cmyb in 36 hpf control MO- and rap1b MO-injected embryos heat shocked at 22 hpf for 45 min with either wild type or the Tg(hsp70:Gal4FF) background (NICD(‒), left column) and with the Tg(hsp70:Gal4FF);(UAS:NICD) background (NICD(+), right column). (G) Percentages of embryos showing normal (blue) and decreased (pink) expressions of cmyb in the AGM regions of embryos heat shocked at 22 hpf, as observed in (F). Control MO/NICD(‒), n=22; rap1b MO/NICD(‒), n=30; Control MO/NICD(+), n=18; rap1b MO/NICD(+), n=19. *, p < 0.05; **, p < 0.01; ***, p < 0.001. (H) Confocal stack fluorescence images of trunk and tail regions of 22 hpf wild type and rap1bncv124 embryos immunostained with anti-GFP (green) and anti-phospho-histone H3 (red) antibodies. Dorsal views with anterior to the left. (I) Number of phospho-histone H3-positive cells within the fli1a:GFP-labeled vascular cord, as observed in (F). Each dot represents the value of individual cells. Error bars indicate means ± s.d. WT, n=11; rap1bncv124, n=12. n.s., not significant. Scale bars: 200 μm (A, F); 50 μm (C); 100 μm (H). |
|
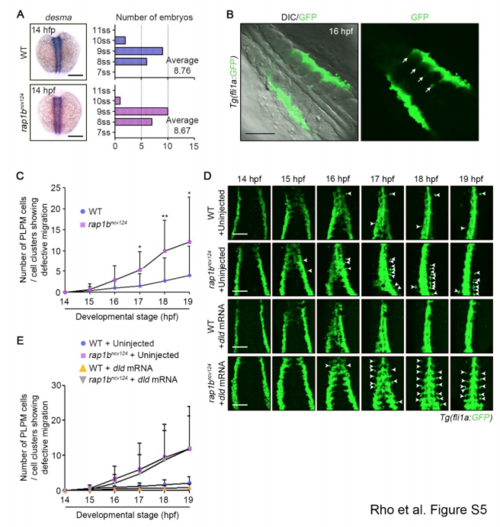
Rap1b Regulates PLPM Cell Migration, Related to Figure 4. (A) Left: Expression patterns of desma in sibling (WT, upper) and rap1bncv124 (lower) embryos at 14 hpf. Dorsal views with anterior to the top. Right: Average number of somites in sibling (upper) and rap1bncv124 (lower) embryos. The number of somites were counted based on the expression of desma. WT, n=31; rap1bncv124, n=28. ss, somite stage. (B) Confocal fluorescence images of 16 hpf Tg(fli1a:GFP) embryos. Dorsal views with anterior to the upper-left. Left, merged image of DIC and GFP; right, GFP image. Arrows indicate somite boundaries. Note that medial PLPM cells migrate along somite boundaries. (C) Number of fli1a:GFP-positive PLPM cells or cell clusters left behind group of migrating cells in wild type (blue circles) or rap1bncv124 (pink squares) embryos at the 11 indicated developmental stages, as observed in Figure 4A. Data are means ± s.d. WT, n=11; rap1bncv124, n=18. *, p < 0.05; **, p < 0.01. (D) Time-lapse confocal images of PLPM cell migration in sibling (WT) and rap1bncv124 Tg(fli1a:GFP) embryos injected without (Uninject) and with dld mRNA from 14-19 hpf. Dorsal views with anterior to the top. Arrowheads indicate the cells that were left behind the group of migrating cells. (E) Number of fli1a:GFP-positive PLPM cells or cell clusters left behind group of migrating cells in wild type embryos injected without (blue circles) or with (yellow triangles) dld mRNA and rap1bncv124 embryos injected without (purple squares) or with (grey triangles) dld mRNA at the indicated developmental stages, as observed in (D). WT, n=7; rap1bncv124, n=9; WT+dld mRNA, n=6; rap1bncv124+dld mRNA, n=8. Scale bars: 200 μm (A); 100 μm (B, D). |
|
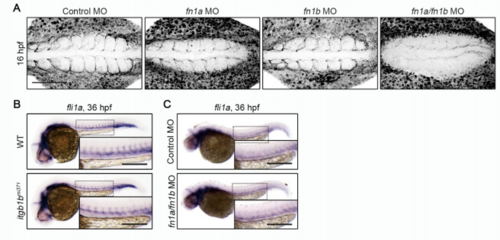
Itgb1b and Fn Are Dispensable for EC Specification, Related to Figure 5 and 6. (A) Confocal stack fluorescence images of 16 hpf wild type embryos injected with control MO, fn1a MO, fn1b MO, and both fn1a and fn1b, and immunostained with anti-Fn antibody. Dorsal views with anterior to the left. (B, C) Expression patterns of fli1a in 36 hpf sibling (WT) and itgb1bmi371 embryos (B) and in 36 hpf embryos injected with control MO and fn1a/fn1b MO (C). Dorsal views with anterior to the left. The boxed areas are enlarged in the insets. Scale bars: 100 μm (A); 200 μm (B, C) |
Reprinted from Developmental Cell, 49(5), Rho, S.S., Kobayashi, I., Oguri-Nakamura, E., Ando, K., Fujiwara, M., Kamimura, N., Hirata, H., Iida, A., Iwai, Y., Mochizuki, N., Fukuhara, S., Rap1b Promotes Notch-Signal-Mediated Hematopoietic Stem Cell Development by Enhancing Integrin-Mediated Cell Adhesion, 681-696.e6, Copyright (2019) with permission from Elsevier. Full text @ Dev. Cell

