
|
Fig. S2
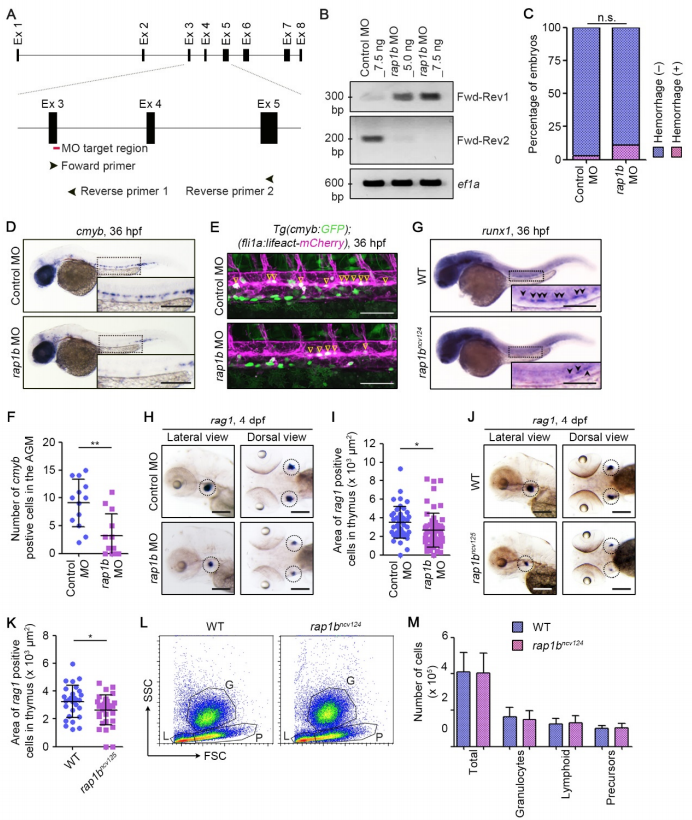
Rap1b Is Involved in HSC Development, Related to Figure 1. (A) Schematic representation of the rap1b gene. Target site of rap1b MO is indicated by red line. PCR primers used for RT-PCR (Forward primer (Fwd), Reverse primer 1 (Rev1), Reverse primer 2 (Rev2)) recognize the sites indicated by arrowheads. (B) RT-PCR analyses of RNAs extracted from the zebrafish embryos injected with 7.5 ng control MO, 5.0 ng rap1b MO or 7.5 ng rap1b MO were performed using two sets of PCR primers (Primer set 1, Fwd-Rev1; Primer set 2, Fwd-Rev2) as indicated in (A) and 5 control PCR primer (ef1a). PCR using Primer set 1 yielded the 305-bp fragment that contains partial sequence of exon 3 and intron 3 only in rap1b MO-injected embryos. In contrast, PCR using Primer set 2 amplified the 206-bp fragment corresponding to normally-spliced rap1b mRNA in control MO-injected embryos, but not in those injected with rap1b MO. (C) Quantification of intracranial hemorrhage in the 7.5 ng control MO- or rap1b MO-injected embryos at 2 dpf. Percentages of normal embryos (blue) and those showing intracranial hemorrhage (pink). Control MO, n=69; rap1b MO, n=68. n.s., not significant. (D) Expression patterns of the HSC marker cmyb in 36 hpf embryos injected with control MO (upper) or rap1b MO (lower). (E) Confocal stack fluorescence images of trunk axial vasculature in 36 hpf embryos injected with control MO (upper) or rap1b MO (lower) in the background of Tg(cmyb:GFP);(fli1a:Myr-mCherry). Lateral views with anterior to the left. Merged images of cmyb:GFP (green) and fli1a:Myr-mCherry (magenta). Arrowheads indicate cmyb:GFP- and fli1a:Myr-mCherry-double positive HSCs located in the ventral side of DA. (F) Number of cmyb:GFP- and fli1a:Myr-mCherry-double positive HSCs in the AGM regions of 36 hpf embryos injected with control MO or rap1b MO in the background of Tg(cmyb:GFP);(fli1a:lifeact-mCherry), as observed in (E). Each dot represents the value of individual embryos. Error bars indicate means ± s.d. Control MO, n=13; rap1b MO, n=13. **, p < 0.01. (G) Expression patterns of HSC marker runx1 in 36 hpf sibling (WT) and rap1bncv124 embryos. Arrowheads indicate runx1-positive HSCs. (H, J) Expression patterns of the lymphoid lineage marker rag1 in the 4 dpf larvae injected with control MO (upper) or rap1b MO (lower) (H) and in the 4 dpf sibling (WT) and rap1bncv125 embryos (J). Lateral (left column) and dorsal (right column) views with anterior to the left. Dotted circles indicate the region of thymus. (I, K) Quantification of the rag1-positive thymus area in the 4 dpf larvae injected with control MO or rap1b MO (I) and in the 4 dpf sibling (WT) and rap1bncv125 embryos (K), as observed in (H, J). Each dot represents the value of individual thymus. Error bars indicate means ± s.d. (I) Control MO, n=23; rap1b MO, n=31. (K) WT, n=14; rap1bncv125, n=16. *, p < 0.05. (L) Representative results of flow cytometric analysis of kidney marrow cells from wild type and rap1bncv124 embryos at 2-3 months of age. G, granulocyte population; L, lymphocyte population; P, precursor cell population. (M) Number of total and each hematopoietic cell population in the kidney marrow from wild type and rap1bncv124 embryos, as observed in (L). In (D) and (G), the boxed areas are enlarged in the insets. Scale bars: 200 μm (D, G, H, J); 100 μm (F).
Reprinted from Developmental Cell, 49(5), Rho, S.S., Kobayashi, I., Oguri-Nakamura, E., Ando, K., Fujiwara, M., Kamimura, N., Hirata, H., Iida, A., Iwai, Y., Mochizuki, N., Fukuhara, S., Rap1b Promotes Notch-Signal-Mediated Hematopoietic Stem Cell Development by Enhancing Integrin-Mediated Cell Adhesion, 681-696.e6, Copyright (2019) with permission from Elsevier. Full text @ Dev. Cell