
|
Fig. 3
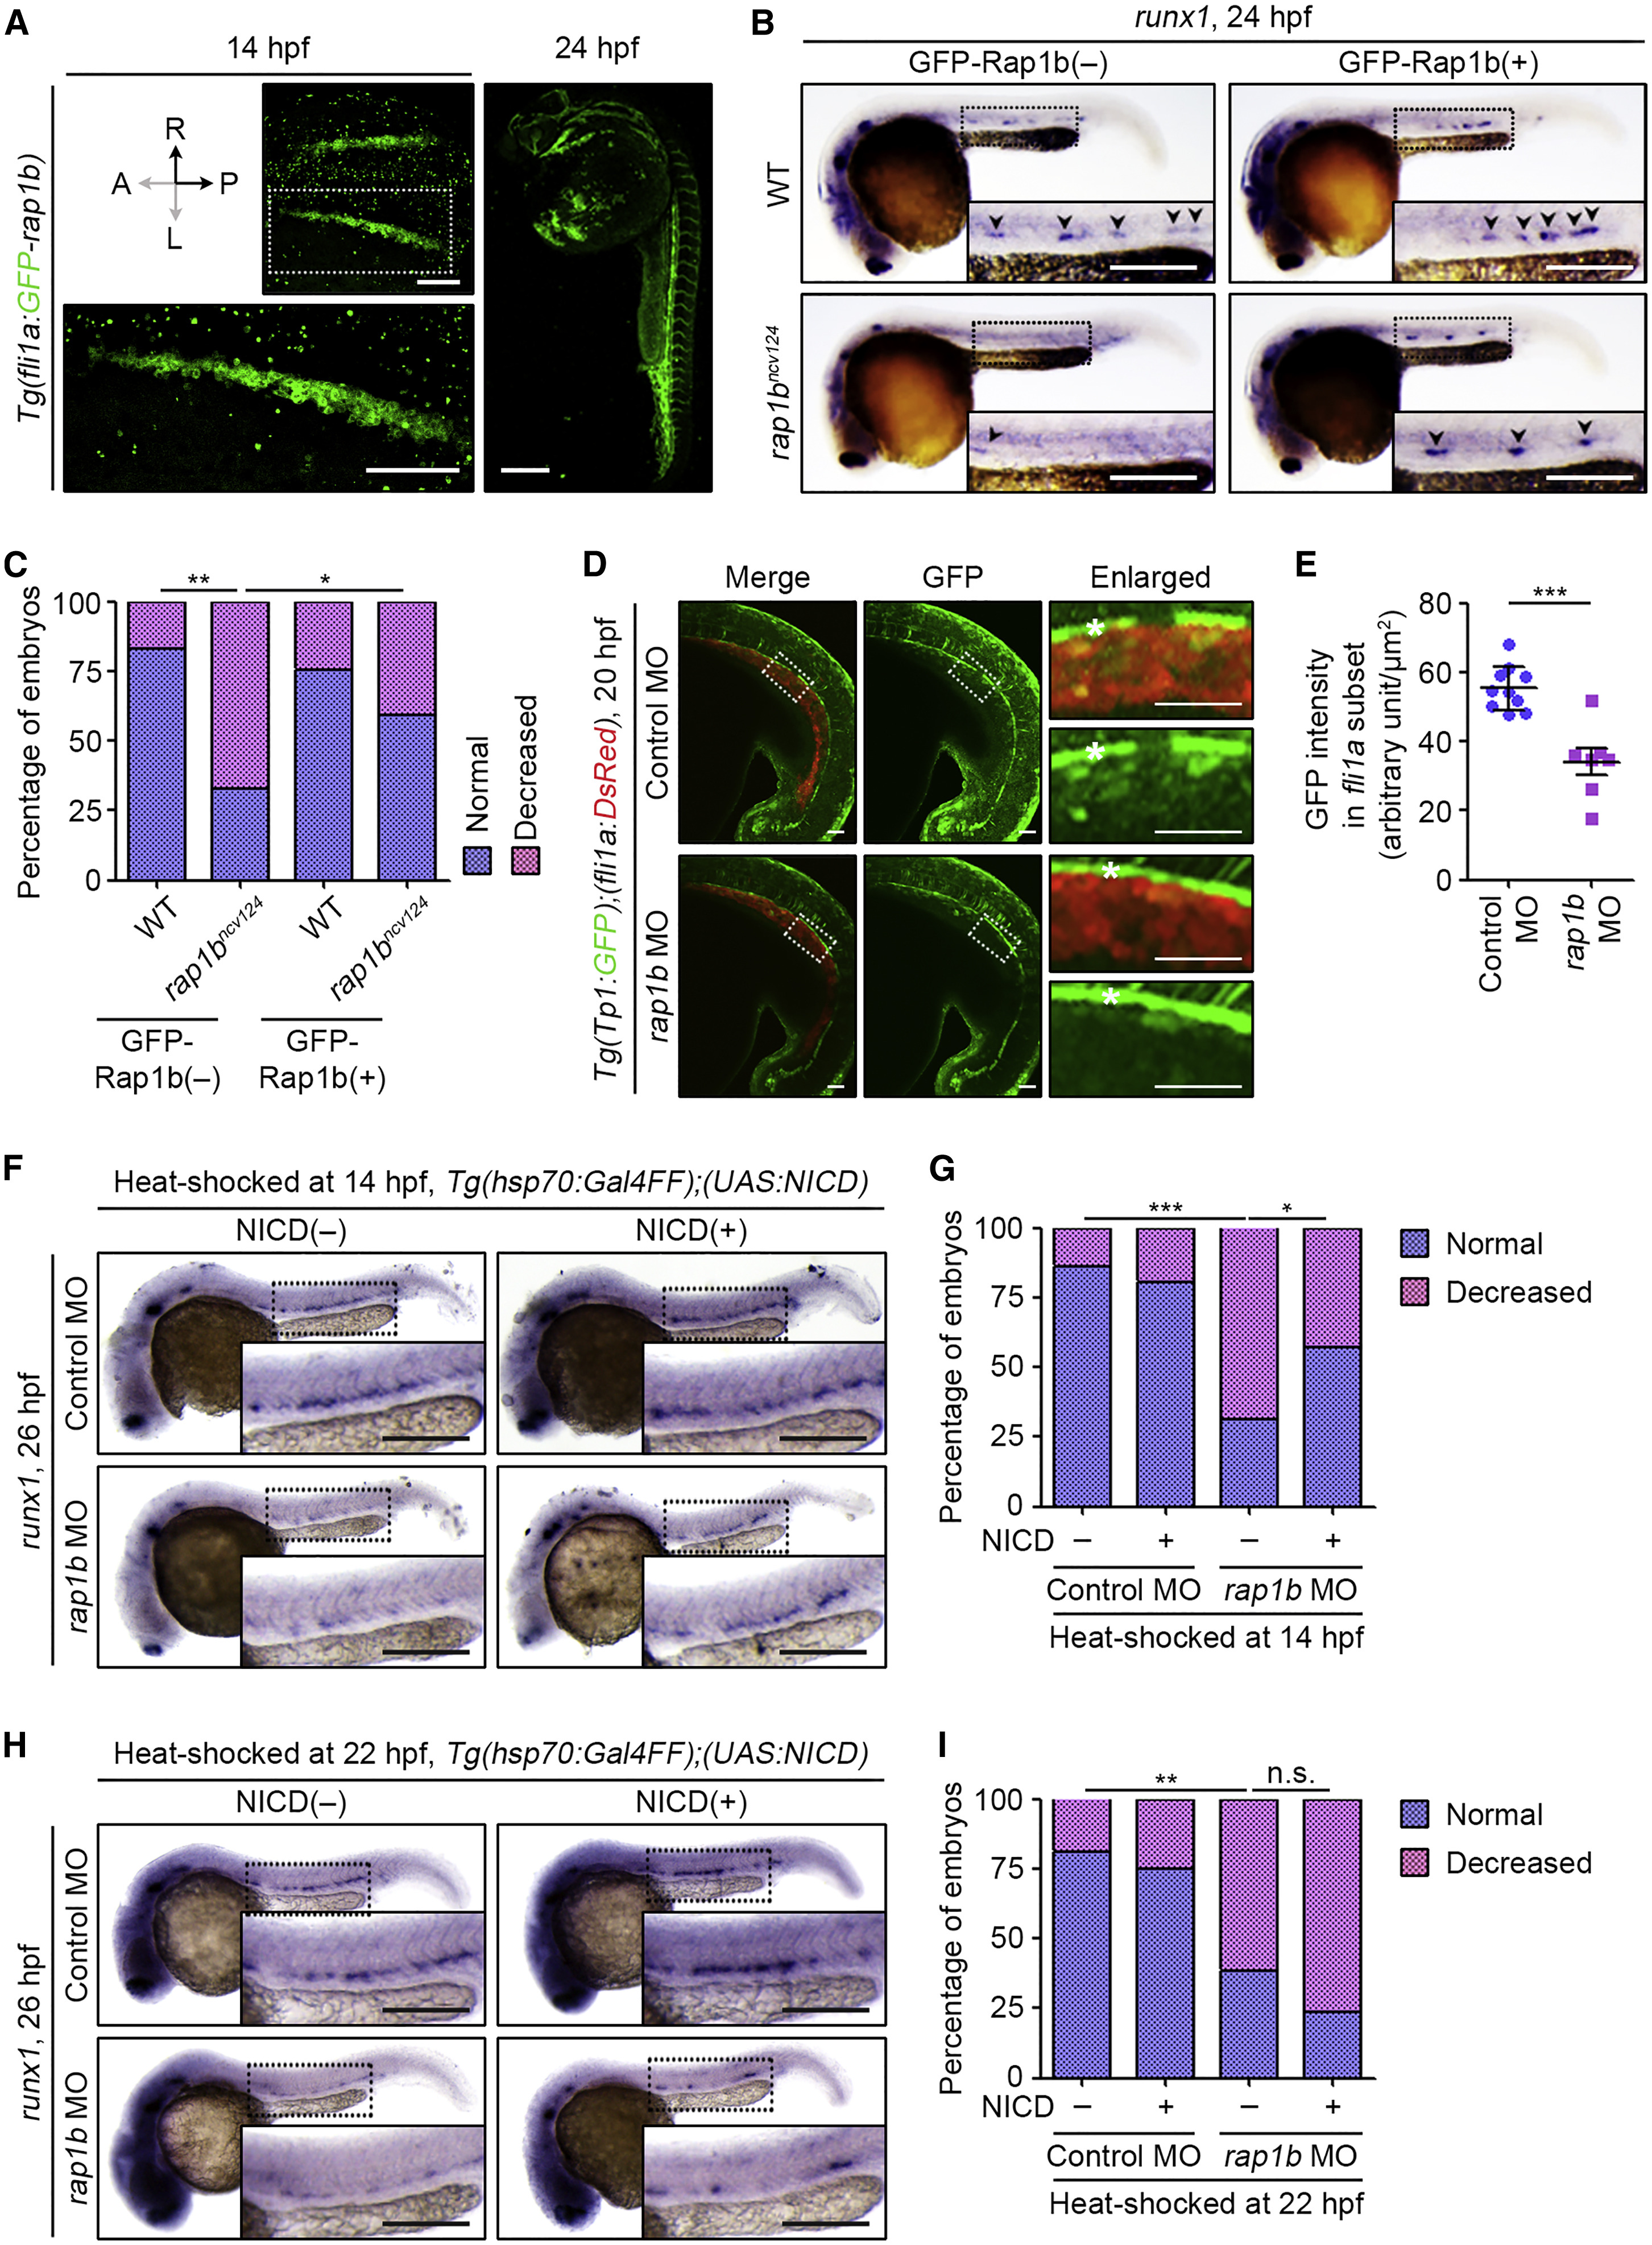
Rap1b Cell-Autonomously Regulates HE Specification through Notch Signaling
(A) Confocal stack images of Tg(fli1a:GFP-rap1b) embryos at 14 (left) and 24 (right) hpf. Left, dorsal views with anterior to the left. Boxed area is enlarged at the bottom. Right, lateral view with anterior to the top. GFP-Rap1b is expressed in lateral plate mesoderm at 14 hpf and in blood vessels at 24 hpf.
(B) Expression patterns of runx1 in 24 hpf sibling (WT, upper) and rap1bncv124 (lower) embryos crossed without (GFP-Rap1b(‒), left column) or with (GFP-Rap1b(+), right column) Tg(fli1a:GFP-rap1b). Arrowheads indicate runx1-positive hemogenic ECs.
(C) Percentages of embryos showing normal (3 or more, blue) and decreased (less than 3, pink) numbers of runx1-positive hemogenic ECs in the AGM regions, as observed in (B). WT+GFP-Rap1b(‒), n = 31; rap1bncv124+GFP-Rap1b(‒), n = 28; WT+GFP-Rap1b(+), n = 23; rap1bncv124+GFP-Rap1b(‒), n = 27. ∗∗p < 0.01; ∗p < 0.05.
(D) Confocal stack fluorescence images of trunk and tail regions of 20 hpf Tg(Tp1:GFP);(fli1a:DsRed) embryos injected with control MO (upper) and rap1b MO (lower). Left, merged images of GFP (green) and DsRed (red); middle, GFP images; right, enlarged merged (upper) and GFP (lower) images of boxed areas. Asterisks indicate notochord-derived Tp1:GFP signal.
(E) Relative fluorescence intensity of Tp1:GFP in the DsRed-labeled vascular cord, as observed in (D). Each dot represents an individual embryo. Error bars indicate means ± SD. Control MO, n = 10; rap1b MO, n = 7. ∗∗∗p < 0.001.
(F and H) Expression patterns of runx1 in 26 hpf control MO- and rap1bMO-injected embryos heat shocked at 14 hpf (F) and 22 hpf (H) for 45 min with either wild type or the Tg(hsp70:Gal4FF) background (NICD(‒), left column) and with the Tg(hsp70:Gal4FF);(UAS:NICD)background (NICD(+), right column).
(G and I) Percentages of embryos showing normal (blue) and decreased (pink) expressions of runx1 in the AGM regions of embryos heat shocked at 14 hpf (G) and 22 hpf (I), as observed in (F) and (H). (G) Control MO/NICD(‒), n = 22; rap1b MO/NICD(‒), n = 32; Control MO/NICD(+), n = 26; rap1b MO/NICD(+), n = 28. (I) Control MO/NICD(‒), n = 32; rap1b MO/NICD(‒), n = 26; Control MO/NICD(+), n = 20; rap1bMO/NICD(+), n = 17. ∗p < 0.05; ∗∗p < 0.01; ∗∗∗p < 0.001; n.s., not significant.
In (B), (F), and (H), boxed areas are enlarged in the insets. Scale bars: 200 μm (A, B, F, and H); 50 μm (D).
Reprinted from Developmental Cell, 49(5), Rho, S.S., Kobayashi, I., Oguri-Nakamura, E., Ando, K., Fujiwara, M., Kamimura, N., Hirata, H., Iida, A., Iwai, Y., Mochizuki, N., Fukuhara, S., Rap1b Promotes Notch-Signal-Mediated Hematopoietic Stem Cell Development by Enhancing Integrin-Mediated Cell Adhesion, 681-696.e6, Copyright (2019) with permission from Elsevier. Full text @ Dev. Cell