
|
Fig. 4
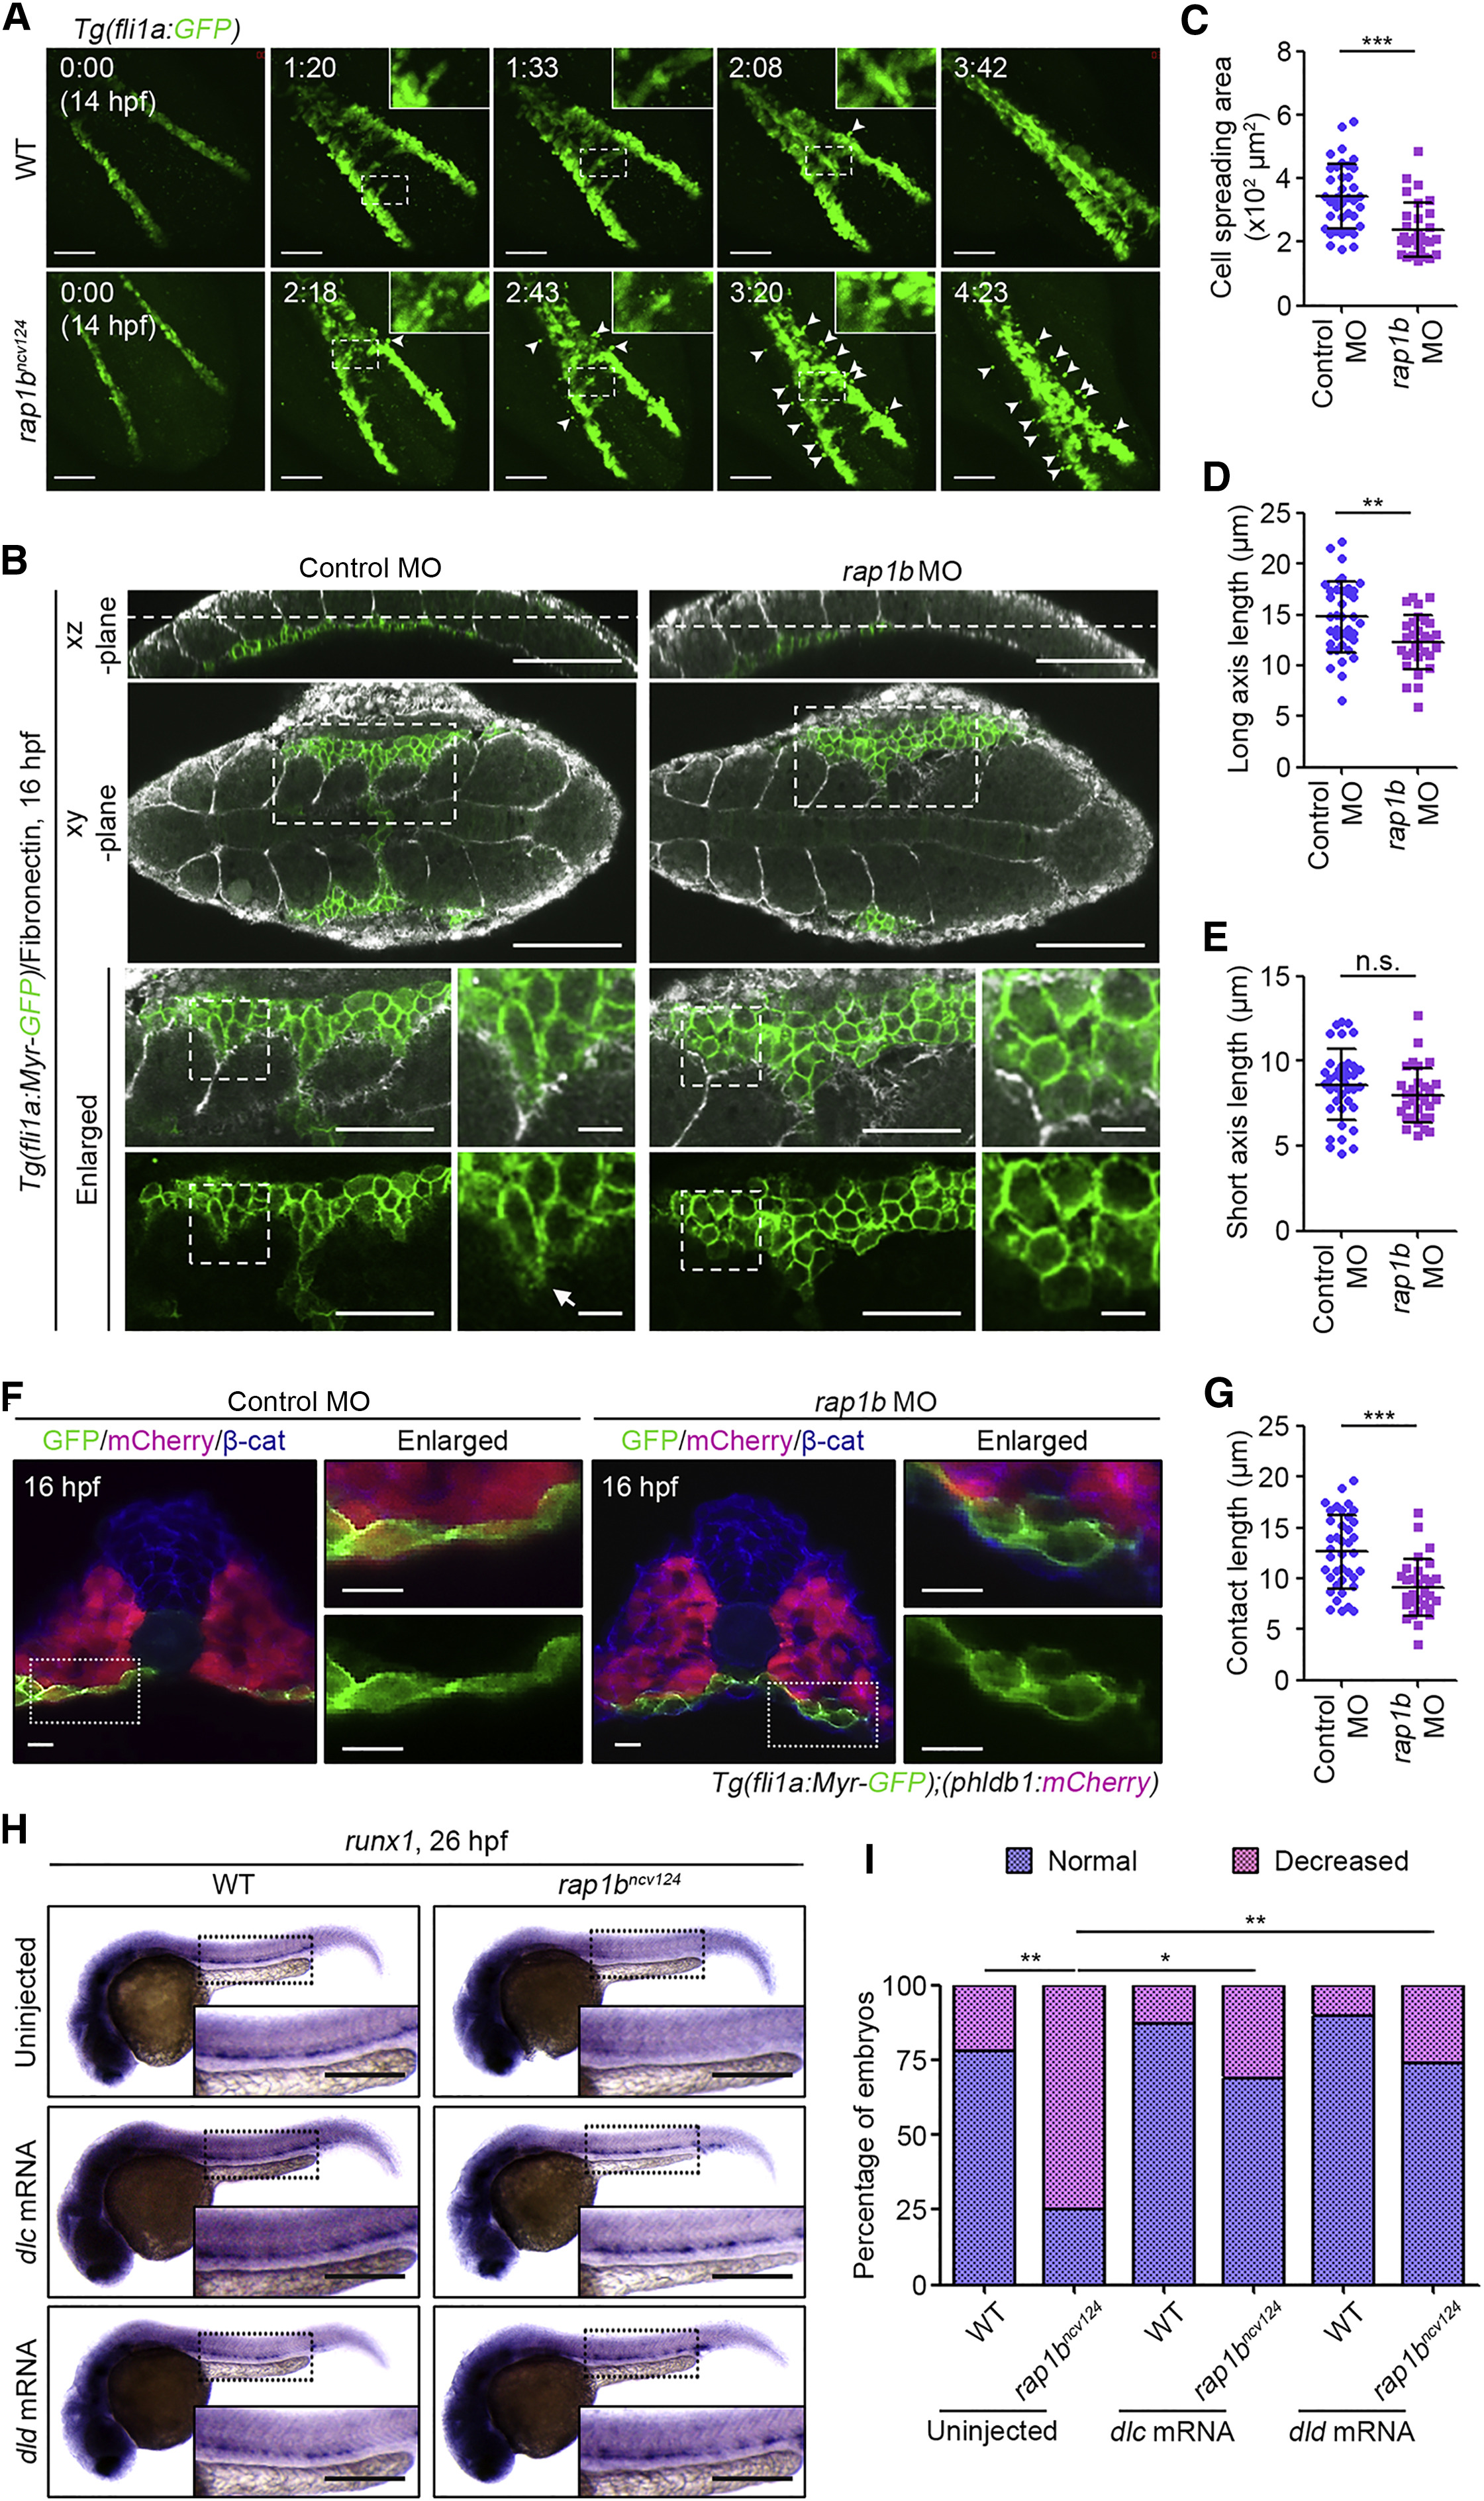
Rap1b Promotes PLPM Cell Adhesion to Somitic Cells to Regulate HE Specification
(A) Confocal stack fluorescence images of PLPM cell migration in sibling (WT, upper) and rap1bncv124 (lower) Tg(fli1a:GFP) embryos at 14 hpf and the corresponding subsequent time-lapse images, obtained at the indicated time points (h:min). Dorsal views with anterior to the upper-left. Arrowheads indicate the cells that remained behind the group of migrating cells.
(B) Confocal fluorescence images of 16 hpf sibling (WT, left) and rap1bncv124 (right) Tg(Myr-fli1a:GFP) embryos immunostained with anti-GFP and anti-Fn antibodies. Merged images of GFP (green) and Fn (white) in the xz-plane (lateral view with anterior to the left) and xy-plane (dorsal view with anterior to the left) are shown in the first and second rows, respectively. Dotted lines on the xz-planes indicate the position of the corresponding xy-planes. The boxed areas in the xy-planes are enlarged at the third (merged images) and fourth (GFP images) rows. The boxed areas in the enlarged images are further enlarged at the right. Arrow indicates membrane protrusion at the leading edge. Note that PLPM cells migrate along somite boundaries labeled by Fn staining.
(C–E) Morphology of PLPM cells migrating along the somite boundaries, as observed in (B). Cell spreading areas (C), cell length relative to the direction of cell migration (D), and cell length perpendicular to the direction of cell migration (E). Each dot represents an individual cell. Error bars indicate means ± SD. Control MO, n = 39; rap1b MO, n = 30. ∗∗p < 0.01; ∗∗∗p < 0.001; n.s., not significant.
(F) Confocal fluorescence images of transverse sections in the posterior region of 16 hpf control MO- and rap1b MO-injected Tg(fli1a:Myr-GFP);(phldb1:mCherry) embryos immunostained with anti-GFP (green), anti-mCherry (red), and anti-β-catenin (blue) antibodies. Left, the merged images of GFP, mCherry, and β-catenin; right, enlarged merged images (upper) and enlarged GFP images (lower) corresponding to the boxed areas.
(G) Contact length of PLPM cells with somitic cells in the control MO- and rap1b MO-injected embryos, as observed in (F). Each dot represents an individual cell. Error bars indicate means ± SD. Control MO, n = 39; rap1b MO, n = 30. ∗∗∗p < 0.001.
(H) Expression patterns of runx1 in 26 hpf sibling (WT, left) and rap1bncv124 (right) embryos injected without (upper) or with dlc mRNA (middle) or dld mRNA (bottom).
(I) Percentage of embryos showing normal (blue) and decreased (pink) expression of runx1 in the AGM regions, as observed in (H). Uninjected WT, n = 18; Uninjected rap1bncv124, n = 16; dlc mRNA-injected WT, n = 15; dlc mRNA-injected rap1bncv124, n = 13; dld mRNA-injected WT, n = 10; dld mRNA-injected rap1bncv124, n = 19. ∗p < 0.05; ∗∗p < 0.01.
In (A) and (H), boxed areas are enlarged in the insets. Scale bars: 100 μm (A and B); 50 μm (left enlarged images in B); 10 μm (right enlarged images in B and F); 200 μm (H).
Reprinted from Developmental Cell, 49(5), Rho, S.S., Kobayashi, I., Oguri-Nakamura, E., Ando, K., Fujiwara, M., Kamimura, N., Hirata, H., Iida, A., Iwai, Y., Mochizuki, N., Fukuhara, S., Rap1b Promotes Notch-Signal-Mediated Hematopoietic Stem Cell Development by Enhancing Integrin-Mediated Cell Adhesion, 681-696.e6, Copyright (2019) with permission from Elsevier. Full text @ Dev. Cell