
- Title
-
Motor axon navigation relies on Fidgetin-like 1-driven microtubule plus end dynamics
- Authors
- Fassier, C., Fréal, A., Gasmi, L., Delphin, C., Ten Martin, D., De Gois, S., Tambalo, M., Bosc, C., Mailly, P., Revenu, C., Peris, L., Bolte, S., Schneider-Maunoury, S., Houart, C., Nothias, F., Larcher, J.C., Andrieux, A., Hazan, J.
- Source
- Full text @ J. Cell Biol.
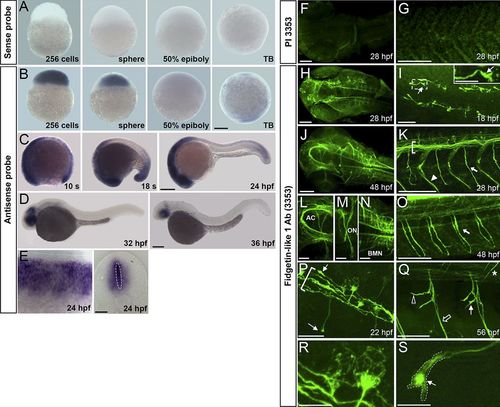
Spatiotemporal expression of Fignl1 during zebrafish development. (A–E) Wholemount in situ hybridization with Fignl1 sense (A) and antisense (B–E) riboprobes at various developmental stages. Lateral views of the embryo with (A and B) animal pole to the top or (C and D) anterior to the left. (E) Lateral (left) and transversal (right) views of the spinal cord. (F–S) Immunolabeling of 18- to 56-hpf embryos with Fignl1 preimmune serum (PI 3353; F and G) or antibody (3353; H–S). Dorsal views of the head (F, H, J, and L–N), dorsal (I), and lateral (G, K, and O–S) views of the trunk; anterior is to the left, are shown. (I) Inset is a higher magnification of the boxed region. (I, P, Q, and S) Thin arrows show Fignl1 enrichment in navigating GCs of pMN (I, P, and S) and sMN (Q) axons. (K, O, and P) Brackets, thick arrows, and arrowhead indicate the ventral longitudinal fasciculus, SMN axons, and lateral myosepta, respectively. (Q) The open arrow, open arrowhead, and asterisk show ventral, rostral, and dorsal motor nerves, respectively. (R and S) MT-like pattern of Fignl1 in SMN soma and GCs. AC, anterior commissure; BMN, branchiomotor neuron; ON, optic nerve; s, somite; TB, tailbud. Bars: (A–D) 200 µm; (E and L–N) 50 µm; (F–H, J, K, O, and Q) 100 µm; (I and P) 25 µm; (R and S) 10 µm. EXPRESSION / LABELING:
|
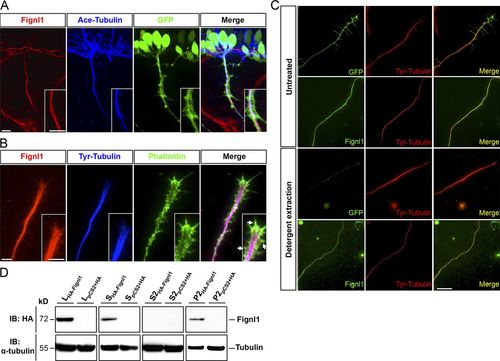
Fignl1 associates with MTs in spinal motor axons. (A) Immunodetection of Fignl1 (red), acetylated α-tubulin (blue), and GFP (green) in 26-hpf Tg(Hb9:GFP) transgenic embryos. Lateral views of the trunk. (B) GC from cultured Tg(Hb9:GFP) SMN labeled with phalloidin (green), tyrosinated tubulin (blue), and Fignl1 (red) antibodies. Arrows indicate actin protrusions. (C) Detergent extraction of soluble proteins from WT or Tg(Hb9:GFP) spinal neurons immunostained by tyrosinated tubulin (red) and Fignl1 or GFP (green). Bars: (A and B) 10 µm; (C) 20 µm. (D) MT copelleting assay from COS-7 cells transfected with pCS2+-HA or pCS2+-HA-Fignl1 (HA-Fignl1). Supernatants (S) were incubated with taxol and GTP to induce MT polymerization and centrifuged on a sucrose cushion to pellet MTs and their associated proteins (P2). Soluble tubulins and proteins that did not bind MTs remained in the S2 supernatant. WBs assessed Fignl1 and α-tubulin levels in different fractions. L, total lysate. EXPRESSION / LABELING:
|
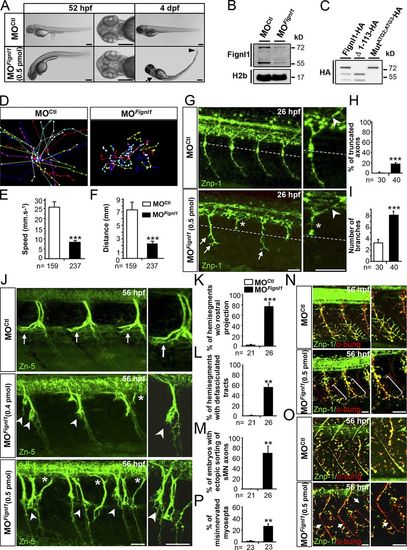
Fignl1 knockdown impairs larval locomotion and spinal motor axon targeting. (A) Lateral and dorsal views of 52-hpf (left) and 4-dpf (right) larvae injected with Fignl1 morpholino (MOFignl1) or a control morpholino (MOCtl). Arrow and arrowhead indicate the atrophy of the pectoral fins and the tail tip. Bars, 250 µm. (B) WB analysis of Fignl1 knockdown efficiency. H2b was a loading control. Full-length blots with the use of preimmune serum or blocking peptides are shown in Fig. S2. (C) WB analysis of Fignl1 isoforms from protein extracts of COS-7 cells expressing HA-tagged WT (Fignl1-HA), mutated (MutATG2;ATG3-HA), or truncated (Δ1–113-HA) versions of Fignl1 with an HA antibody. Fignl1 isoforms are schematized in Fig. S2. (D–F) Tracking analysis of 56-hpf control and Fignl1 morphant larvae in a touch-escape response test. (D) Plot line representation of larval escape behavior. Each line represents the trajectory of one larva. (E) Mean swimming speed. (F) Mean covered distance. (G) Immunolabeling of pMN axons in 26-hpf MOCtl and MOFignl1 embryos with Znp-1 antibody. CaP axons of MOFignl1 embryos were truncated and stalled (asterisks) at the horizontal myoseptum (dotted line) or showed aberrant distal branches (arrows), whereas middle pMN axons were unaffected (arrowheads). (H and I) Quantification of pMN axon defects. (J) Immunolabeling of sMNs in 56-hpf MOCtl and MOFignl1 larvae with Zn-5 antibody. Arrows show control rostral nerves. Arrowheads indicate the absence of rostral nerves and the aberrant defasciculation of MOFignl1 motor tracts. Asterisks point out the ectopic sorting of MOFignl1 sMN axons. (K–M) Quantifications of sMN axon defects. (N and O) Immunolabeling of neuromuscular junctions (yellow, merge staining) in 56-hpf MOCtl and MOFignl1 larvae using pre- (Znp-1, green) and postsynaptic (AchR by α-bungarotoxin, red) markers. MOFignl1 larvae showed defective innervation of lateral myotome (N, brackets) and myosepta (O, arrows). (P) Percentage of misinnervated lateral myosepta. Quantifications were performed on 12 hemisegments around the yolk tube. **, P ≤ 0.01; ***, P ≤ 0.001; unpaired two-tailed t test. Error bars are SEM. The number (n) of embryos analyzed in three independent experiments is indicated under the corresponding histogram bar. (G, J, N, and O) Lateral views of the trunk; anterior is to the left. Right panels are higher magnifications of left panels. Bars, 25 µm. |
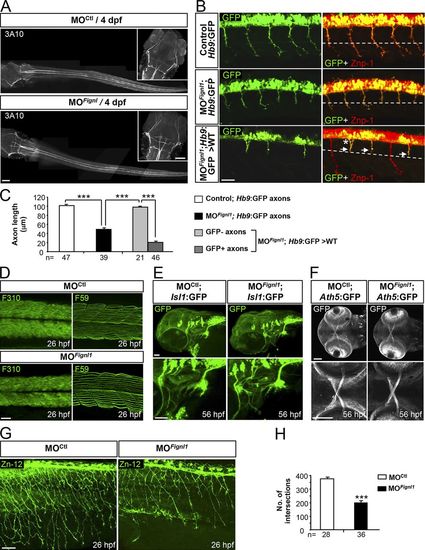
Fignl1 is mainly required for spinal motor axon targeting. (A) Immunolabeling of the Mauthner fibers in 4-dpf MOCtl (n = 17) and MOFignl1 (n = 19) larvae using the 3A10 antibody. Dorsal views of the larvae; anterior is to the left. Insets are higher magnifications of the head. (B) Immunostaining of SMN with Znp-1 and GFP antibodies in 30-hpf nontransplanted control (Hb9:GFP), morphant (MOFignl1; Hb9:GFP), and WT embryos transplanted with SMN precursors from MOFignl1 Tg(Hb9:GFP) embryos. The dashed line indicates the horizontal myoseptum. Arrows and asterisk show stalled or misrouted SMN axons, respectively. (C) Mean length of SMN axons. The number of axons analyzed is indicated under each histogram bar. (D) Immunostaining of slow and fast muscle fibers in 26-hpf MOCtl (n = 15) and MOFignl1 (n = 15) embryos using F59 and F310 antibodies. (E) Analysis of branchiomotor axons in 56-hpf MOCtl (n = 20) and MOFignl1 (n = 25) Tg(Islet1:GFP) larvae. Lateral views of the head; anterior is to the left. (F) Analysis of the optic nerve in 56-hpf MOCtl (n = 20) and MOFignl1(n = 20) Tg(Ath5:GFP) larvae. Ventral views of the head; anterior is to the left. Bottom panels are higher magnifications of top panels. (G) Immunostaining of mechanosensory RB neurons in 26-hpf MOCtl and MOFignl1 embryos. Skin innervation by RB axons is reduced in morphant embryos. (B, D, and G) Lateral views of the trunk; anterior is to the left. (H) Quantification of skin innervation using a stereological method (Rønn et al., 2000). The number of intersections between RB axons and a grid of 11 parallel lines spaced every 22 µm was estimated in 26-hpf MOCtl (n = 28) and MOFignl1 embryos (n = 36) from three independent experiments. ***, P ≤ 0.0001; unpaired two-tailed t test. Error bars are SEM. Bars: (A) 100 µm; (B) 25 µm; (D) 40 µm; (E and G) 50 µm; (F) 60 µm. |
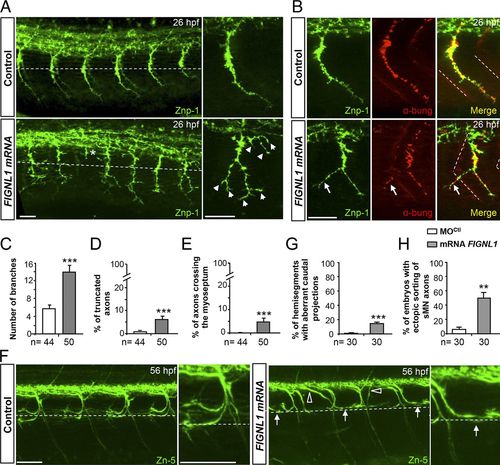
FIGNL1 overexpression leads to spinal motor axon pathfinding defects. (A) Immunolabeling of pMN axons in 26-hpf control and human FIGNL1 mRNA–injected embryos with the use of Znp-1 antibody. Arrowheads and asterisk indicate hyperbranched or truncated pMN axons. (B) Analysis of neuromuscular junctions in 26-hpf control and FIGNL1 mRNA–injected embryos with the use of pre- (Znp-1, green) and postsynaptic markers. α-bung, α-bungarotoxin (red). Arrows indicate aberrant synapses between CaP axons and muscle fibers from the neighboring somite. (C) Mean number of branches. (D) Percentage of truncated axons. (E) Percentage of axons crossing the lateral myoseptum. (F) Immunolabeling of sMN axons with Zn-5 antibody in 56-hpf control and human FIGNL1 mRNA–injected larvae. Arrows show misguided rostral pMN–like sMNs. Open arrowheads indicate aberrant sMN axon exit points. (A, B, and F) Lateral views of the trunk; anterior is to the left. Right panels are higher magnifications of one SMN axon from the left panels. Dashed lines indicate the horizontal myotome (A and F) or lateral myosepta (B). Bars: (A and B) 25 µm; (F) 50 µm. (G) Percentage of hemisegments with aberrant caudal projections. (H) Percentage of embryos with ectopic sorting of sMN axons. The total number (n) of embryos from three independent experiments is indicated under the corresponding histogram bar. 24 hemisegments were analyzed per animal. **, P ≤ 0.01; ***, P ≤ 0.001; unpaired two-tailed t test. Error bars are SEM. |

Fignl1 modulates SMN morphology via MT remodeling. (A) SMN primary cultures from 24-hpf MOCtl or MOFignl1 Tg(Hb9:GFP) embryos labeled at 9 hpp with a GFP antibody. (B) Percentage of enlarged GCs. (C) Mean GC area. (D) Mean length of the longest neurite. (B–D) 179 MOCtl and 157 MOFignl1 SMNs were analyzed in three independent experiments. (E) Immunostaining of 26-hpf MOCtl and MOFignl1 Tg(Hb9:GFP) embryos using a GFP antibody. Lateral views of the trunk; anterior is to the left. Right images are higher magnifications of spinal motor CGs on facing left images. Open arrowheads indicate enlarged GCs. Dashed lines outline the horizontal myoseptum. (F) SMN primary culture from 24-hpf control and Fignl1 mRNA–injected Tg(Hb9:GFP) embryos labeled 9 hpp with GFP antibody. (A and F) Insets show higher magnifications of GCs. (G) Percentage of SMNs with enlarged GCs, collateral branches, and one, two, three, or more neurites. Quantifications were performed on 1,300 control and Fignl1-injected SMN in four independent experiments. (H) Immunodetection of MTs (red) and F-actin (green) in cultured control, Fignl1-depleted, or Fignl1-overexpressing Tg(Hb9:GFP) SMNs at 9 hpp. Dashed lines outline the GC surface. Bars, 10 µm. (I) GC area occupied by MTs. Quantifications on at least 13 MOCtl and MOFignl1 SMNs selected from three independent experiments. *, P ≤ 0.05; **, P ≤ 0.01; ***, P ≤ 0.001; unpaired two-tailed t test. Error bars are SEM. |
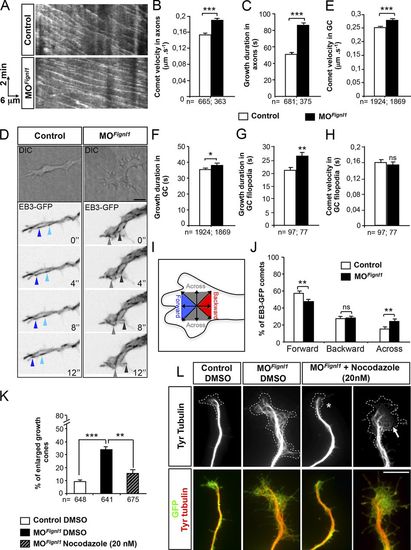
Fignl1 depletion alters MT plus end dynamics in navigating motor axons and GCs. (A–C) Time-lapse recordings of EB3-GFP comets in SMN axons of 52-hpf control and MOFignl1 Tg(Hb9:Gal4;UAS:EB3-GFP) larvae (related to Videos 6 and 7). (A) Representative kymograms of a 5-min EB3-GFP recording from control and morphant SMN axons. Horizontal bar, 6 µm; vertical bar, 2 min. (B and C) Mean comet velocity (B) and growth duration (C) in SMN axons. (D–J) Time-lapse recordings of EB3-GFP comets in cultured control and MOFignl1 Tg(Hb9:Gal4;UAS:EB3-GFP) SMNs. (D) Top panels are differential interference contrast (DIC) images illustrating GC morphology. Bottom panels are still z projection images extracted from EB3-GFP time-lapse videos (related to Videos 8 and 9). Blue and gray arrowheads point at EB3 comets moving forward toward the leading edge of the GC or across the GC, respectively. (E–H) Mean comet velocity (E and H) and growth duration (F and G) in GCs (E and F) and GC filopodia (G and H). (B, C, and E–H) EB3 comets were monitored in SMN axons of at least 10 control and MOFignl1 larvae (B and C) or in 15 control and MOFignl1 GCs (E–J) from three independent experiments. (I) Diagram illustrating the assessment of comet directionality in GCs. (J) Quantification of comet directionality in GCs. (K and L) Primary cultures of SMNs from 24-hpf control and MOFignl1 Tg(Hb9:GFP) embryos treated 3 hpp with 20 nM nocodazole or DMSO and labeled at 9 hpp with GFP and tyrosinated tubulin (Tyr tubulin) antibodies (L). Dotted line indicates GC surface. Nocodazole treatment rescues the GC area (asterisk) and reduces MT invasion in GC (arrow) of morphant SMNs. (K) Percentage of enlarged motor GCs. The total number (n) of analyzed comets or neurons from three independent experiments is mentioned under the histogram bar. *, P ≤ 0.05; **, P ≤ 0.01; ***, P ≤ 0.001; unpaired two-tailed t test (B, C, and E–H) and Kruskal–Wallis ANOVA test with Dunn’s post hoc test (K). Error bars are SEM. Bars: (D) 5 µm; (L) 10 µm. |
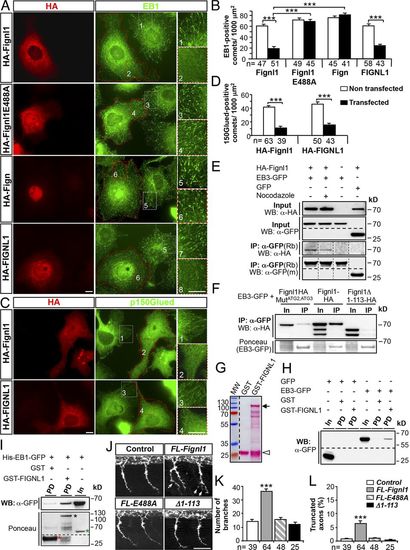
FL-Fignl1 isoform specifically binds EB1/3 and negatively regulates +TIP binding at MT plus ends. (A–D) COS-7 cells overexpressing HA-tagged WT (FL-Fignl1–HA; A–D) and mutated (HA-Fignl1E488A; A and B) zebrafish Fignl1, zebrafish Fign (HA-Fign; A and B), and human Fignl1 (HA-FIGNL1; A–D) were immunolabeled with HA (A and C: red) and EB1 (A: green) or p150Glued (C: green) antibodies. (A and C) Red dashed lines indicate transfected cells. Right panels represent higher magnifications of boxed regions in corresponding panels. (B and D) Mean number of EB1- (B) or p150Glued-positive (D) comets per 1,000 µm2. (E) Co-IP of HA-Fignl1 with EB3-GFP. COS-7 cells were cotransfected with HA-Fignl1 and EB3-GFP or GFP and treated with 20 µM nocodazole or DMSO 24 h posttransfection (hpt). (F) Co-IP of Fignl1 isoforms with EB3-GFP. COS-7 cells were cotransfected with Fignl1-HA, Fignl1MutATG2-ATG3-HA, or Fignl1Δ1–113-HA and EB3-GFP. Ponceau staining shows immunoprecipitated EB3-GFP. (E and F) Co-IP assays were performed 24 hpt with a GFP antibody. (G) Ponceau staining shows the expression of recombinant GST (open arrowhead) and GST-FIGNL1 (arrow) in BL21 E. coli purified on glutathione Sepharose beads. Lower bands result from protein degradation. MW, molecular weight. (H and I) GST pulldown assays. EB3-GFP from COS-7 cells or recombinant His-EB1-GFP (I) were incubated with either GST or GST-FIGNL1–bound beads. (I) Ponceau staining (bottom) shows GST (red asterisk), GST-FIGNL1 (black asterisk), and His-EB1-GFP (green asterisk) recombinant proteins. (E, F, H, and I) Immunoprecipitated or pulled-down proteins were revealed by using HA or GFP antibody. In, input; IP, immunoprecipitation; m, mouse; PD, pulldown; Rb, rabbit. (J) Immunolabeling of pMNs in 26-hpf control and WT Fignl1 (FL-Fignl1), E488A Fignl1 (FL-E488A), or Fignl1Δ1–113 (Δ1–113) mRNA–injected embryos with the use of Znp-1 antibody. Arrows point at aberrant pMN collateral branches. (K) Mean number of branches. (L) Percentage of truncated axons. Quantifications on 12 spinal hemisegments per embryo. The total number (n) of analyzed cells or embryos per condition in three independent experiments is indicated under the histogram bars. ***, P ≤ 0.001; unpaired two-tailed t test (B and D) or Kruskal–Wallis ANOVA test with Dunn’s post hoc test (K and L). Error bars are SEM. Bars: (A and C) 20 µm; (J) 50 µm. |
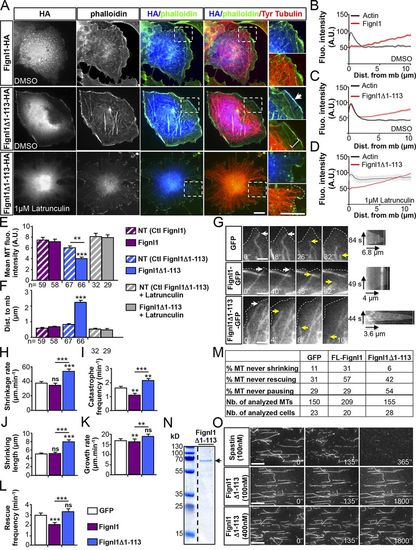
The N-terminally truncated Fignl1 isoforms promote MT depolymerization at the cell cortex. (A) COS-7 cells transfected with Fignl1-HA or Fignl1Δ1–113-HA were treated with DMSO or latrunculin B 24 h posttransfection and labeled with phalloidin, HA, and tyrosinated tubulin (Tyr tubulin) antibodies. Right: Higher magnifications of boxed regions in corresponding panels. Dotted line outlines the plasma membrane. Arrow points out the colocalization between Fignl1Δ1–113 and cortical F-actin. Bracket indicates the reduced density of MTs beneath the cell cortex of Fignl1Δ1–113-HA–expressing cells. (B–D) Mean fluorescence intensity of F-actin and Fignl1-HA (B) or Fignl1Δ1–113-HA (C and D) in COS-7 cells treated with DMSO (B and C) or latrunculin B (D). Dist. from mb, distance from membrane. (E) MT fluorescence intensity beneath the cell cortex. NT, nontransfected. (F) Mean distance between MT plus ends and the plasma membrane (Dist. to mb). (G–M) Live TIRF recordings of MT behavior beneath the cell membrane of MEFs expressing α-tubulin–mCherry and Fignl1-GFP, Fignl1Δ1–113-GFP, or GFP. (G) Representative time series (left) and kymograms (right) of individual MT behavior at the cell membrane (dashed lines). White and yellow arrows, respectively, point at MT ends contacting the membrane or undergoing catastrophe. Black arrows are kymogram scale bars. (H–L and M) MT dynamic instability analyses. Catastrophe and rescue frequencies (I and L), shrinkage and growth rates (H and K), shrinking length (J), and the percentage of MT that never shrunk, grew, or paused (M) were calculated from kymograph analysis of at least 150 MTs per condition. **, P ≤ 0.01; ***, P ≤ 0.001; Kruskal–Wallis ANOVA test with Dunn’s post hoc test. Error bars are SEM. The total number of cells (E, F, and M) or MTs (M) analyzed per condition in three independent experiments is indicated under the histogram bar (E and F) or in the table (M). Nb., number. (N) Coomassie blue–stained SDS-PAGE gel showing purified His-Fignl1Δ1–113 (arrow). (O) In vitro MT-severing assay. Atto 565–labeled and biotinylated taxol-stabilized MTs were immobilized in perfusion chambers. GFP-spastin (top) or His-Fignl1Δ1–113 (middle and bottom) were diluted to 100 or 400 nM and perfused into the chambers. Panels are representative time frames of TIRF recordings acquired every 5 min over 30 min. Bars: (A) 20 µm; (G) 3 µm; (O) 5 µm. |

Morpholinos targeted against Fignl1 mRNA specifically alter motor axon targeting and larval mobility compared with control morpholinos. (A–C) Analysis of larval mobility using a touch–escape response test. (A) Tracking analysis of noninjected larvae (Control; n = 24) and larvae injected with Fignl1- mismatch (MOCtl; n = 25) or control scramble morpholinos (MOScramble; n = 24) at 56 hpf. Each line represents the trajectory of one larva after a touch stimulation. (B and C) Quantifications of the mean swimming distance (B) and velocity (C). (D) Immunolabeling of primary (top) and secondary (bottom) motor neurons in 26- and 56-hpf control, MOCtl, and MOScramble embryos by using Znp-1 (top) and Zn-5 (bottom) antibodies. Injection of each control morpholino does not affect motor neuron development compared with noninjected control embryos and larvae. Bars, 50 μm. (E) Primary cultures of SMNs from 24-hpf control, MOCtl, and MOScramble Tg(Hb9: GFP) embryos immunolabeled at 9 hpp with anti-GFP (in green) and tyrosinated-tubulin (in red) antibodies. GC morphology of MOCtl and MOScramble motor neurons were undistinguishable from control GCs. Bar, 10 μm. (F and G) Analysis of 56-hpf control (n = 41) and MOFignl1BIS-injected (n = 69) larval locomotion in a touch–escape response test. (F) Quantification of the mean swimming distance. (G) Quantification of the mean swimming speed. (H–J) Analysis of pMN in 26-hpf control (n = 17) and MOFignl1BIS-injected embryos (n = 21). (H) Mean percentage of truncated axons. (J) Mean number of branches. (H and J) Quantifications were performed on 12 hemisegments around the yolk tube. (I) Immunostaining of 26-hpf control and MOFignl1BIS-injected embryos by using Znp-1 antibody. Some ventrally projecting CaP axons of MOFignl1BIS-injected embryos appear truncated (asterisks) or show aberrant distal branches (arrows). (K–M) Analysis of sMN in 56-hpf control (n = 18) and morphant (n = 18) larvae. (K) Mean percentage of hemisegments without sMN rostral projection. (M) Percentage of hemisegments with defasciculated sMN tracts. Quantifications were performed on 24 hemisegments. (L) Immunolabeling of sMN in 56-hpf control and MOFignl1BIS-injected larvae by using Zn-5 antibody. sMN axons of MOFignl1BIS-injected larvae fail to grow rostrally and defasciculate at the horizontal myoseptum (arrows). (N and O) Quantification of the mean covered distance (N) and mean swimming speed (O) of 56-hpf control (n = 38), Fignl1 morphant (n = 100), and doubly (MOFignl1 + FIG NL1-mRNA) injected (n = 64) larvae in a touch–escape response test. (P) Immunostaining of sMNs in 56-hpf control (n = 17), Fignl1 morphant (n = 17), and doubly injected larvae (MOFignl1 + FIG NL1-mRNA; n = 19) by using Zn-5 antibody. Human FIG NL1 overexpression partially rescued the abnormal defasciculation of rostral projections (arrows) and the aberrant ectopic sorting (arrowheads) of morphant sMN tracts. Bars, 40 μm. (D, I, L, and P) Lateral views of the trunk; anterior to the left. n values indicate the total number of embryos analyzed in at least three independent experiments. (Q and R) Percentage of hemisegments with defasciculated sMN tracts (Q) and abnormal sMN rostral projections (R). Quantifications were performed on 24 hemisegments. ns, P > 0.05; **, P ≤ 0.01; ***, P ≤ 0.001; unpaired two-tailed t test. Error bars are SEM. |
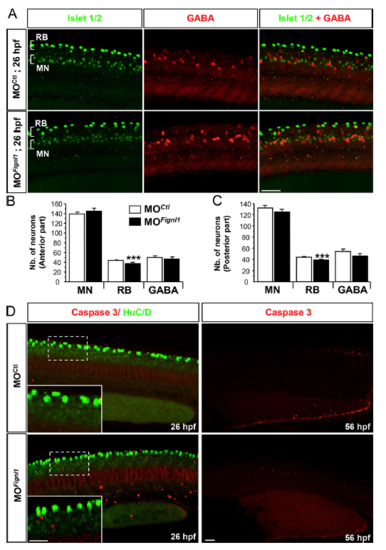
Fignl1 depletion does not perturb the specification, localization, or survival of SMNs. (A) Immunolabeling of SMNs (MNs), RB sensory neurons, and GABAergic interneurons in 26-hpf MOCtl and MOFignl1 embryos with Islet1/2 (green) and GABA (red) antibodies. Lateral views of the trunk; anterior is to the left. Bar, 50 μm. (B and C) Mean number (Nb.) of MNs, RB neurons, and GABAergic interneurons (GABA). Quantifications were performed on 26-hpf control (n = 22) and morphant (n = 21) embryos pooled from three independent experiments. 12 hemisegments were analyzed in the anterior (B) and posterior regions (C) of each embryonic trunk. ***, P ≤ 0.001; unpaired two-tailed t test. Error bars are SEM. (D) Immunolabeling of activated caspase 3 (red) and the neuronal postmitotic marker HuC/D (green; left) or caspase 3 alone (red; right) in 26- (left) or 56-hpf (right) MOCtl and MOFignl1 embryos and larvae. Insets represent higher magnifications of the indicated boxed regions. Fignl1 knockdown does not induce apoptotic cell death of spinal neurons. Bars, 30 μm. |
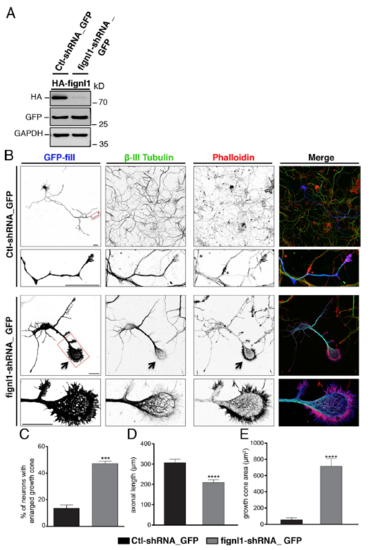
Knockdown of fignl1 in cultured mammalian neurons affects GC morphology and MT organization as in zebrafish neurons. (A) Knockdown efficiency of Fignl1-shRNA. WB analysis of protein extracts from COS-7 cells cotransfected with mouse HA-Fignl13′UTR and control-shRNA_GFP or 3′UTR-targeted Fignl1-shRNA_GFP (cloned in pSUP ER.neo + GFP vectors) by using HA, GFP, and GAP DH antibodies. GFP and GAP DH were used as transfection and loading controls, respectively. HA-Fignl1 expression is strikingly reduced by Fignl1-shRNA. (B) Cultured hippocampal neurons transfected at DIV1 with control-shRNA_GFP or Fignl1-shRNA_GFP and stained at DIV3 for GFP, β-III tubulin, and F-actin (phalloidin). Bottom panels are higher magnifications of the corresponding boxed region. Arrows indicate enlarged GCs of Fignl1-shRNA transfected neurons. Bars, 30 μm. (C) Mean percentage of transfected neurons with enlarged GCs. Quantifications were carried out on at least 150 transfected neurons per condition in three independent experiments. (D) Mean axonal length. (E) Mean GC area. Quantifications were performed on 32 control-shRNA_GFP- and 33 Fignl1-shRNA-GFP–transfected neurons collected from three independent experiments. ***, P ≤ 0.001; ****, P ≤ 0.0001; unpaired two-tailed t test. Error bars are SEM. |

Fignl1 overexpression displaces +TIPs from MT plus ends through its specific interaction with EB1/3. (A) Overexpression of HA-tagged zebrafish spastin (spastin-HA), zebrafish Fignl1 (HA-Fignl1), and human fignl1 (HA-FIG NL1) in COS-7 cells and immunolabeling with HA (red) and tyrosinated tubulin (green) antibodies 24 hpt. Transfected cells are delineated by red dashed lines. Bottom panels represent higher magnifications of boxed regions in corresponding panels. (B) Mean MT fluorescence intensity related to cell area. (C and D) Overexpression of GFP-tagged human FIG NL1 (FIG NL1-GFP) or GFP alone (GFP) in COS-7 cells followed by immunolabeling by using GFP (C, blue), EB1 (C, green), and tyrosinated tubulin (C, red) antibodies or GFP (D, red) and EB3 (D, green) antibodies at 24 hpt. Transfected cells are delineated by blue (C) or red (D) dotted lines. Right panels represent higher magnifications of the indicated boxed region on adjacent left panels. (E) Mean number of EB1- and EB3-positive comets per 1,000 μm2. (F and G) COS-7 cells transfected with HA-Fignl1 and immunolabeled with HA, acetylated (Ace Tubulin), and tyrosinated tubulin (Tyr tubulin) antibodies. (F) Mean acetylated tubulin fluorescence intensity related to cell area. (G) Transfected cells are delineated by blue dashed lines. (H) COS-7 cells transfected with HA-Fignl1 were treated 24 hpt with 20 μM nocodazole for 15 min or with DMSO as a control and stained with HA and tyrosinated tubulin antibodies. Bars: (A, C and D [main images], F, and H) 20 μm; (C and D, insets) 10 μm. (I) Mean MT fluorescence intensity related to cell area. NT, nontransfected. The total number of cells (n) analyzed per condition in three independent experiments is mentioned under the corresponding histogram bar. **, P ≤ 0.01; ***, P ≤ 0.001; unpaired two-tailed t test. Error bars are SEM. (J) Co-IP of HA-Fignl1 or mutated HA-Fignl1E488A with EB1-GFP. COS-7 cells cotransfected with EB1-GFP and HA-Fignl1 or HA-Fignl1E488A were lysed in RIPA buffer 24 hpt. Co-IP assays were performed with a GFP antibody, and immunoprecipitated (IP) proteins were revealed by WB using HA or GFP antibodies. WT and ATP hydrolysis-deficient zebrafish Fignl1 equally coimmunoprecipitate with the core +TIP EB1. (K) co-IP of HA-tagged Fignl1 isoforms and their homologues Fign and spastin with EB3-GFP. COS-7 cells were cotransfected with EB3-GFP and FL-Fignl1–HA, Fignl1Δ1–113-HA, HA-Fign, or spastin-HA. Co-IP assays were performed 24 hpt with a GFP antibody, and immunoprecipitated proteins were revealed using either HA or GFP antibody. m: mouse; Rb, rabbit. |