
|
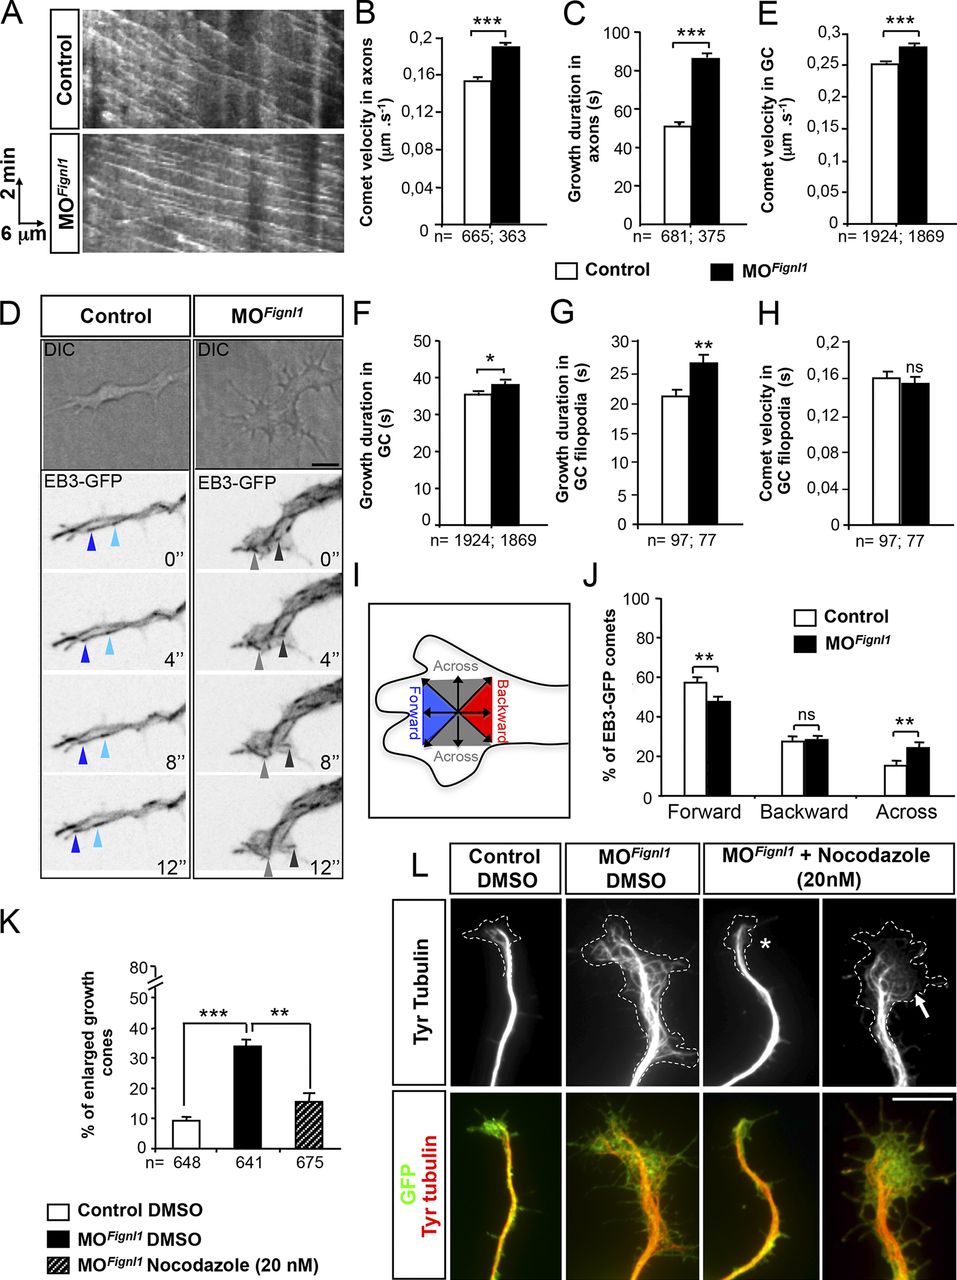
Fig. 7
Fignl1 depletion alters MT plus end dynamics in navigating motor axons and GCs. (A–C) Time-lapse recordings of EB3-GFP comets in SMN axons of 52-hpf control and MOFignl1 Tg(Hb9:Gal4;UAS:EB3-GFP) larvae (related to Videos 6 and 7). (A) Representative kymograms of a 5-min EB3-GFP recording from control and morphant SMN axons. Horizontal bar, 6 µm; vertical bar, 2 min. (B and C) Mean comet velocity (B) and growth duration (C) in SMN axons. (D–J) Time-lapse recordings of EB3-GFP comets in cultured control and MOFignl1 Tg(Hb9:Gal4;UAS:EB3-GFP) SMNs. (D) Top panels are differential interference contrast (DIC) images illustrating GC morphology. Bottom panels are still z projection images extracted from EB3-GFP time-lapse videos (related to Videos 8 and 9). Blue and gray arrowheads point at EB3 comets moving forward toward the leading edge of the GC or across the GC, respectively. (E–H) Mean comet velocity (E and H) and growth duration (F and G) in GCs (E and F) and GC filopodia (G and H). (B, C, and E–H) EB3 comets were monitored in SMN axons of at least 10 control and MOFignl1 larvae (B and C) or in 15 control and MOFignl1 GCs (E–J) from three independent experiments. (I) Diagram illustrating the assessment of comet directionality in GCs. (J) Quantification of comet directionality in GCs. (K and L) Primary cultures of SMNs from 24-hpf control and MOFignl1 Tg(Hb9:GFP) embryos treated 3 hpp with 20 nM nocodazole or DMSO and labeled at 9 hpp with GFP and tyrosinated tubulin (Tyr tubulin) antibodies (L). Dotted line indicates GC surface. Nocodazole treatment rescues the GC area (asterisk) and reduces MT invasion in GC (arrow) of morphant SMNs. (K) Percentage of enlarged motor GCs. The total number (n) of analyzed comets or neurons from three independent experiments is mentioned under the histogram bar. *, P ≤ 0.05; **, P ≤ 0.01; ***, P ≤ 0.001; unpaired two-tailed t test (B, C, and E–H) and Kruskal–Wallis ANOVA test with Dunn’s post hoc test (K). Error bars are SEM. Bars: (D) 5 µm; (L) 10 µm.