
|
Fig. 3
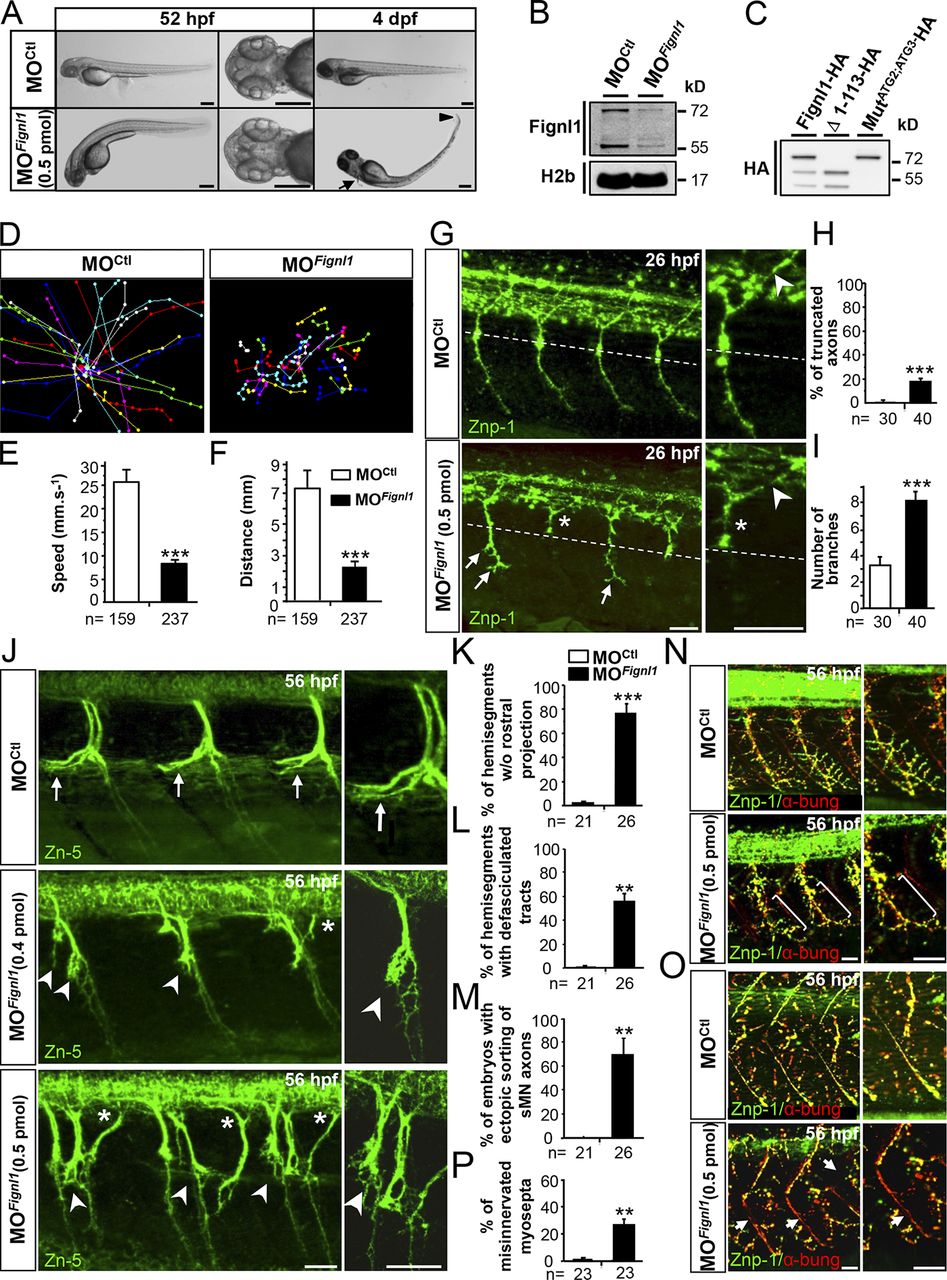
Fignl1 knockdown impairs larval locomotion and spinal motor axon targeting. (A) Lateral and dorsal views of 52-hpf (left) and 4-dpf (right) larvae injected with Fignl1 morpholino (MOFignl1) or a control morpholino (MOCtl). Arrow and arrowhead indicate the atrophy of the pectoral fins and the tail tip. Bars, 250 µm. (B) WB analysis of Fignl1 knockdown efficiency. H2b was a loading control. Full-length blots with the use of preimmune serum or blocking peptides are shown in Fig. S2. (C) WB analysis of Fignl1 isoforms from protein extracts of COS-7 cells expressing HA-tagged WT (Fignl1-HA), mutated (MutATG2;ATG3-HA), or truncated (Δ1–113-HA) versions of Fignl1 with an HA antibody. Fignl1 isoforms are schematized in Fig. S2. (D–F) Tracking analysis of 56-hpf control and Fignl1 morphant larvae in a touch-escape response test. (D) Plot line representation of larval escape behavior. Each line represents the trajectory of one larva. (E) Mean swimming speed. (F) Mean covered distance. (G) Immunolabeling of pMN axons in 26-hpf MOCtl and MOFignl1 embryos with Znp-1 antibody. CaP axons of MOFignl1 embryos were truncated and stalled (asterisks) at the horizontal myoseptum (dotted line) or showed aberrant distal branches (arrows), whereas middle pMN axons were unaffected (arrowheads). (H and I) Quantification of pMN axon defects. (J) Immunolabeling of sMNs in 56-hpf MOCtl and MOFignl1 larvae with Zn-5 antibody. Arrows show control rostral nerves. Arrowheads indicate the absence of rostral nerves and the aberrant defasciculation of MOFignl1 motor tracts. Asterisks point out the ectopic sorting of MOFignl1 sMN axons. (K–M) Quantifications of sMN axon defects. (N and O) Immunolabeling of neuromuscular junctions (yellow, merge staining) in 56-hpf MOCtl and MOFignl1 larvae using pre- (Znp-1, green) and postsynaptic (AchR by α-bungarotoxin, red) markers. MOFignl1 larvae showed defective innervation of lateral myotome (N, brackets) and myosepta (O, arrows). (P) Percentage of misinnervated lateral myosepta. Quantifications were performed on 12 hemisegments around the yolk tube. **, P ≤ 0.01; ***, P ≤ 0.001; unpaired two-tailed t test. Error bars are SEM. The number (n) of embryos analyzed in three independent experiments is indicated under the corresponding histogram bar. (G, J, N, and O) Lateral views of the trunk; anterior is to the left. Right panels are higher magnifications of left panels. Bars, 25 µm.