
|
Fig. 9
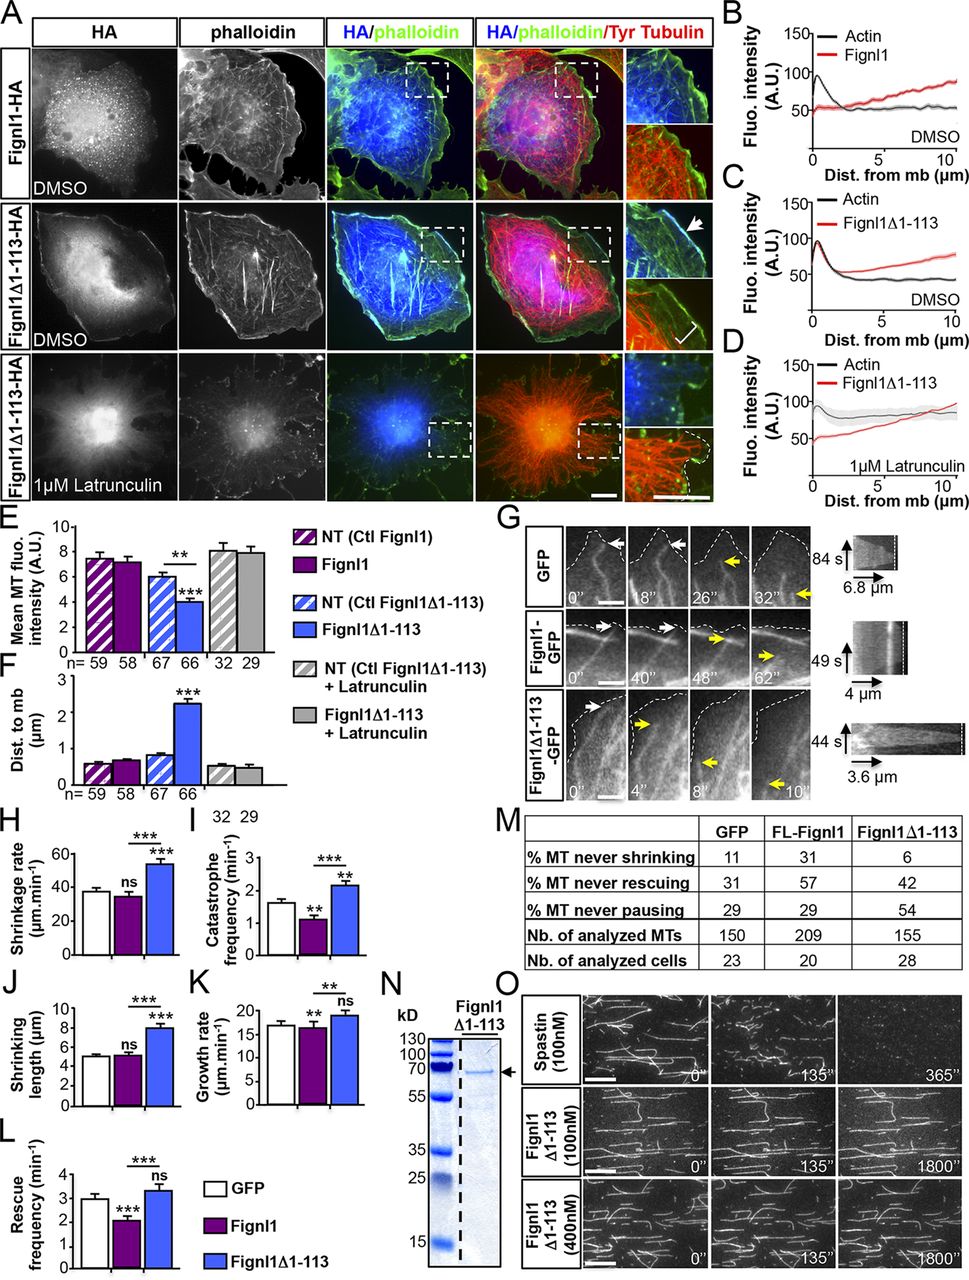
The N-terminally truncated Fignl1 isoforms promote MT depolymerization at the cell cortex. (A) COS-7 cells transfected with Fignl1-HA or Fignl1Δ1–113-HA were treated with DMSO or latrunculin B 24 h posttransfection and labeled with phalloidin, HA, and tyrosinated tubulin (Tyr tubulin) antibodies. Right: Higher magnifications of boxed regions in corresponding panels. Dotted line outlines the plasma membrane. Arrow points out the colocalization between Fignl1Δ1–113 and cortical F-actin. Bracket indicates the reduced density of MTs beneath the cell cortex of Fignl1Δ1–113-HA–expressing cells. (B–D) Mean fluorescence intensity of F-actin and Fignl1-HA (B) or Fignl1Δ1–113-HA (C and D) in COS-7 cells treated with DMSO (B and C) or latrunculin B (D). Dist. from mb, distance from membrane. (E) MT fluorescence intensity beneath the cell cortex. NT, nontransfected. (F) Mean distance between MT plus ends and the plasma membrane (Dist. to mb). (G–M) Live TIRF recordings of MT behavior beneath the cell membrane of MEFs expressing α-tubulin–mCherry and Fignl1-GFP, Fignl1Δ1–113-GFP, or GFP. (G) Representative time series (left) and kymograms (right) of individual MT behavior at the cell membrane (dashed lines). White and yellow arrows, respectively, point at MT ends contacting the membrane or undergoing catastrophe. Black arrows are kymogram scale bars. (H–L and M) MT dynamic instability analyses. Catastrophe and rescue frequencies (I and L), shrinkage and growth rates (H and K), shrinking length (J), and the percentage of MT that never shrunk, grew, or paused (M) were calculated from kymograph analysis of at least 150 MTs per condition. **, P ≤ 0.01; ***, P ≤ 0.001; Kruskal–Wallis ANOVA test with Dunn’s post hoc test. Error bars are SEM. The total number of cells (E, F, and M) or MTs (M) analyzed per condition in three independent experiments is indicated under the histogram bar (E and F) or in the table (M). Nb., number. (N) Coomassie blue–stained SDS-PAGE gel showing purified His-Fignl1Δ1–113 (arrow). (O) In vitro MT-severing assay. Atto 565–labeled and biotinylated taxol-stabilized MTs were immobilized in perfusion chambers. GFP-spastin (top) or His-Fignl1Δ1–113 (middle and bottom) were diluted to 100 or 400 nM and perfused into the chambers. Panels are representative time frames of TIRF recordings acquired every 5 min over 30 min. Bars: (A) 20 µm; (G) 3 µm; (O) 5 µm.