
|
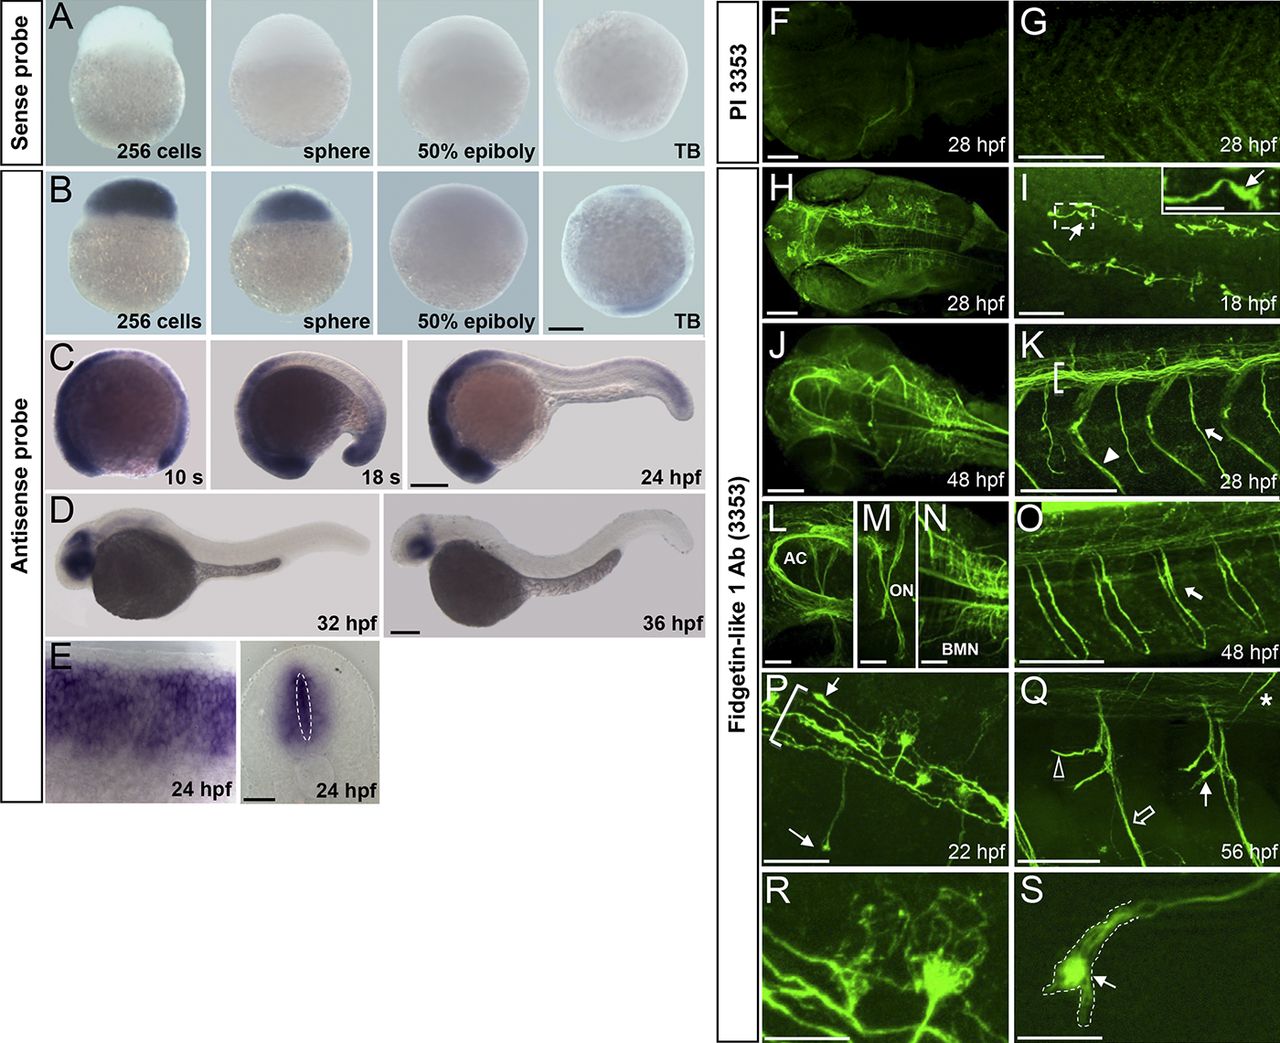
Fig. 1
Spatiotemporal expression of Fignl1 during zebrafish development. (A–E) Wholemount in situ hybridization with Fignl1 sense (A) and antisense (B–E) riboprobes at various developmental stages. Lateral views of the embryo with (A and B) animal pole to the top or (C and D) anterior to the left. (E) Lateral (left) and transversal (right) views of the spinal cord. (F–S) Immunolabeling of 18- to 56-hpf embryos with Fignl1 preimmune serum (PI 3353; F and G) or antibody (3353; H–S). Dorsal views of the head (F, H, J, and L–N), dorsal (I), and lateral (G, K, and O–S) views of the trunk; anterior is to the left, are shown. (I) Inset is a higher magnification of the boxed region. (I, P, Q, and S) Thin arrows show Fignl1 enrichment in navigating GCs of pMN (I, P, and S) and sMN (Q) axons. (K, O, and P) Brackets, thick arrows, and arrowhead indicate the ventral longitudinal fasciculus, SMN axons, and lateral myosepta, respectively. (Q) The open arrow, open arrowhead, and asterisk show ventral, rostral, and dorsal motor nerves, respectively. (R and S) MT-like pattern of Fignl1 in SMN soma and GCs. AC, anterior commissure; BMN, branchiomotor neuron; ON, optic nerve; s, somite; TB, tailbud. Bars: (A–D) 200 µm; (E and L–N) 50 µm; (F–H, J, K, O, and Q) 100 µm; (I and P) 25 µm; (R and S) 10 µm.