
|
Fig. S1
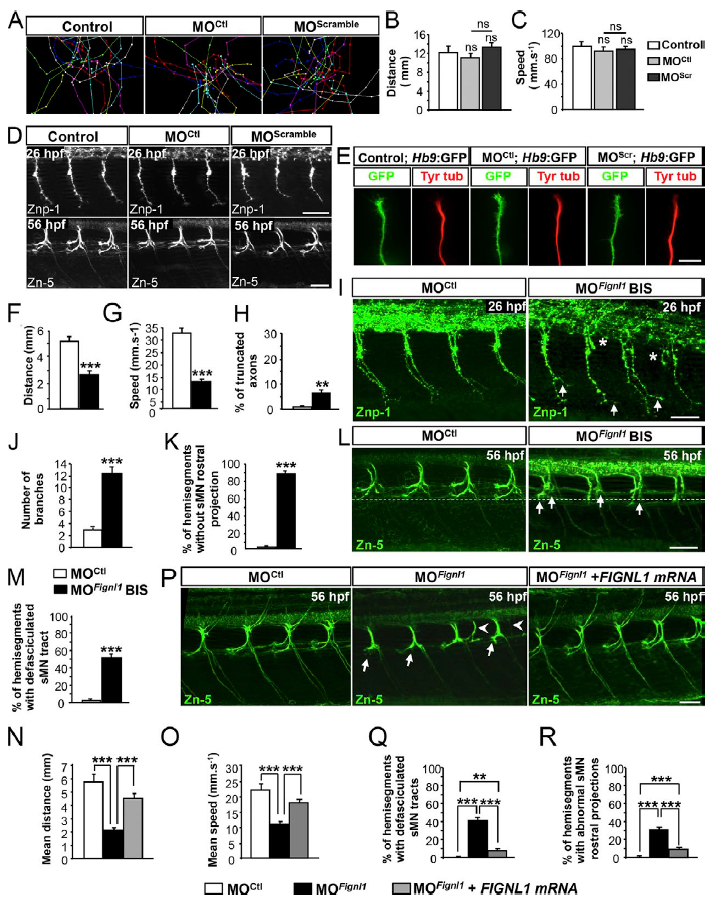
Morpholinos targeted against Fignl1 mRNA specifically alter motor axon targeting and larval mobility compared with control morpholinos. (A–C) Analysis of larval mobility using a touch–escape response test. (A) Tracking analysis of noninjected larvae (Control; n = 24) and larvae injected with Fignl1- mismatch (MOCtl; n = 25) or control scramble morpholinos (MOScramble; n = 24) at 56 hpf. Each line represents the trajectory of one larva after a touch stimulation. (B and C) Quantifications of the mean swimming distance (B) and velocity (C). (D) Immunolabeling of primary (top) and secondary (bottom) motor neurons in 26- and 56-hpf control, MOCtl, and MOScramble embryos by using Znp-1 (top) and Zn-5 (bottom) antibodies. Injection of each control morpholino does not affect motor neuron development compared with noninjected control embryos and larvae. Bars, 50 μm. (E) Primary cultures of SMNs from 24-hpf control, MOCtl, and MOScramble Tg(Hb9: GFP) embryos immunolabeled at 9 hpp with anti-GFP (in green) and tyrosinated-tubulin (in red) antibodies. GC morphology of MOCtl and MOScramble motor neurons were undistinguishable from control GCs. Bar, 10 μm. (F and G) Analysis of 56-hpf control (n = 41) and MOFignl1BIS-injected (n = 69) larval locomotion in a touch–escape response test. (F) Quantification of the mean swimming distance. (G) Quantification of the mean swimming speed. (H–J) Analysis of pMN in 26-hpf control (n = 17) and MOFignl1BIS-injected embryos (n = 21). (H) Mean percentage of truncated axons. (J) Mean number of branches. (H and J) Quantifications were performed on 12 hemisegments around the yolk tube. (I) Immunostaining of 26-hpf control and MOFignl1BIS-injected embryos by using Znp-1 antibody. Some ventrally projecting CaP axons of MOFignl1BIS-injected embryos appear truncated (asterisks) or show aberrant distal branches (arrows). (K–M) Analysis of sMN in 56-hpf control (n = 18) and morphant (n = 18) larvae. (K) Mean percentage of hemisegments without sMN rostral projection. (M) Percentage of hemisegments with defasciculated sMN tracts. Quantifications were performed on 24 hemisegments. (L) Immunolabeling of sMN in 56-hpf control and MOFignl1BIS-injected larvae by using Zn-5 antibody. sMN axons of MOFignl1BIS-injected larvae fail to grow rostrally and defasciculate at the horizontal myoseptum (arrows). (N and O) Quantification of the mean covered distance (N) and mean swimming speed (O) of 56-hpf control (n = 38), Fignl1 morphant (n = 100), and doubly (MOFignl1 + FIG NL1-mRNA) injected (n = 64) larvae in a touch–escape response test. (P) Immunostaining of sMNs in 56-hpf control (n = 17), Fignl1 morphant (n = 17), and doubly injected larvae (MOFignl1 + FIG NL1-mRNA; n = 19) by using Zn-5 antibody. Human FIG NL1 overexpression partially rescued the abnormal defasciculation of rostral projections (arrows) and the aberrant ectopic sorting (arrowheads) of morphant sMN tracts. Bars, 40 μm. (D, I, L, and P) Lateral views of the trunk; anterior to the left. n values indicate the total number of embryos analyzed in at least three independent experiments. (Q and R) Percentage of hemisegments with defasciculated sMN tracts (Q) and abnormal sMN rostral projections (R). Quantifications were performed on 24 hemisegments. ns, P > 0.05; **, P ≤ 0.01; ***, P ≤ 0.001; unpaired two-tailed t test. Error bars are SEM.