
- Title
-
Insm1a Regulates Motor Neuron Development in Zebrafish
- Authors
- Gong, J., Wang, X., Zhu, C., Dong, X., Zhang, Q., Wang, X., Duan, X., Qian, F., Shi, Y., Gao, Y., Zhao, Q., Chai, R., Liu, D.
- Source
- Full text @ Front. Mol. Neurosci.
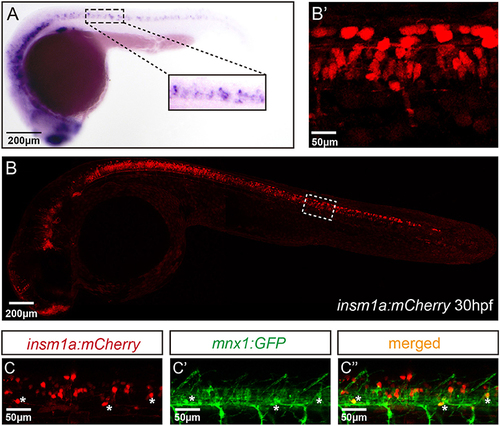
Insm1a expression in embryonic zebrafish spinal cord and primary motor neurons. (A) At 24 hpf, the in situ hybridization signal of insm1a is localized in the spinal cord., Scale bar = 200 μm. (B) The confocal imaging analysis of the transgene insm1a:mCherry expression at 30 hpf. Square in dash line indicates the magnified region in (B') Scale bar = 50 μm. (C,C',C”). Confocal imaging analysis of Tg(mnx1:GFP)ml2 × Tg(insm1a: mCherry)ntu805 transgenic line. |
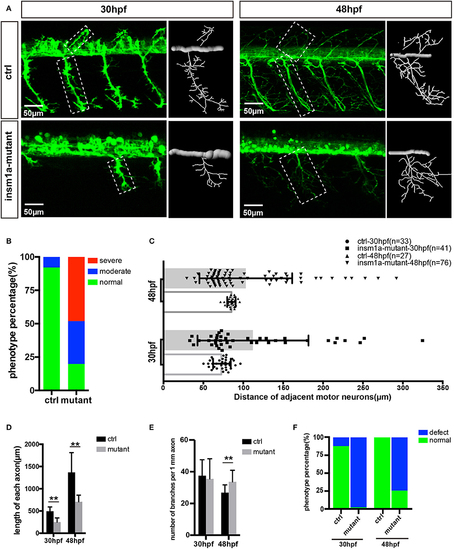
Primary motor neuron morphogenesis defects in the insm1a mutant zebrafish embryos. (A) Confocal imaging analysis of primary motor neuron in control group and insm1a mutant groups at 30 hpf and 48 hpf Tg(mnx1:GFP)ml2. Caps in dash line are showed in diagrams. Scale bar = 50 μm. (B) Quantification of zebrafish embryos with abnormal Caps. The zebrafish embryos are classified into three categories according to its loss degree: severe group with over 80% loss of Cap primary motor neuron, moderate group with <80% loss, and normal group with <20% loss. (C) Quantification of distance between adjacent motor neurons (μm) in control group and insm1a mutant groups at 30 hpf (n = 33 and 41 respectively) and 48 hpf (n = 27 and 76 respectively). (D,E) The length and branching number of Cap axons in control group and insm1a mutant groups at 30 and 48 hpf. Asterisks above the bars indicate significant differences (**P < 0.01). (F) Quantification of zebrafish embryos with abnormal Caps at 30 and 48 hpf. |
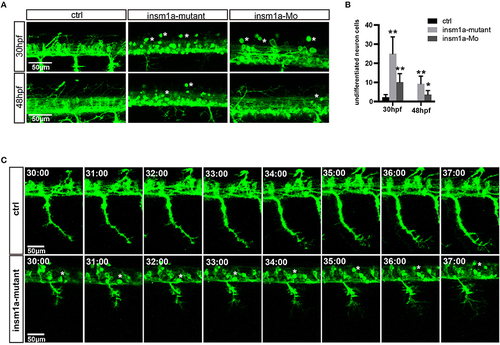
Insm1a deficiency suppressed neuronal cells differentiation. (A) Confocal imaging analysis of primary motor neuron in control group, insm1a mutant group and morphant group at 30 and 48 hpf Tg(mnx1:GFP)ml2. Phenotypes of neuronal cells in the spinal cord in control group, morphant group, and insm1a mutant groups at 30 hpf and 48 hpf. Asterisks indicate undifferentiated neuronal cells. Scale bar = 50 μm. (B) Quantification of the undifferentiated neuronal cell in the insm1a different treatment zebrafish. Asterisks above the bars indicate significant differences (*P < 0.05, **P < 0.01). (C) Time-lapse imaging analysis of the primary motor neuron in control group and insm1a mutant groups. Asterisks represent undifferentiated neuronal cells. Scale bar = 50 μm |

ZFIN is incorporating published figure images and captions as part of an ongoing project. Figures from some publications have not yet been curated, or are not available for display because of copyright restrictions. PHENOTYPE:
|
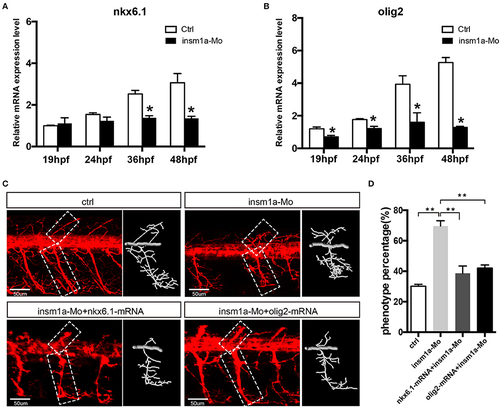
Over expressions of nkx6.1 and olig2 rescued the motor neuron defects in insm1a deficient embryos. (A,B). Effects of insm1a knockdown on the expressions of nkx6.1 and olig2 at 19, 24, 36, and 48 hpf. Asterisks indicate significant differences (*P < 0.05). (C) Abnormal Caps in insm1a knockdown zebrafish embryos were restored by co-injection of nkx6.1 or olig2 mRNA. Diagrams of Caps in dash line are displayed near the corresponding confocal image. Scale bar = 50 μm. (D) Quantification of zebrafish embryos with abnormal Cap primary motor neuron. Asterisks indicate significant differences (**P < 0.01). EXPRESSION / LABELING:
PHENOTYPE:
|
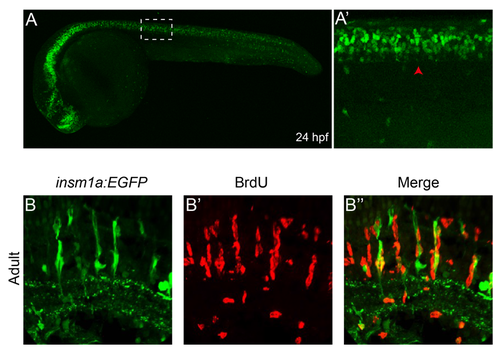
Insm1a:GFP transgene expression patterns in embryonic and adult zebrafish. A, Confocal imaging analysis of Tg(insm1a: EGFP) ntu804 transgenic zebrafish line at 24 hpf. A' The magnified image of rectangle in dash line. B-B'' Confocal imaging analysis of injured retina of adult Tg(insm1a: EGFP) ntu804 transgenic zebrafish line. |
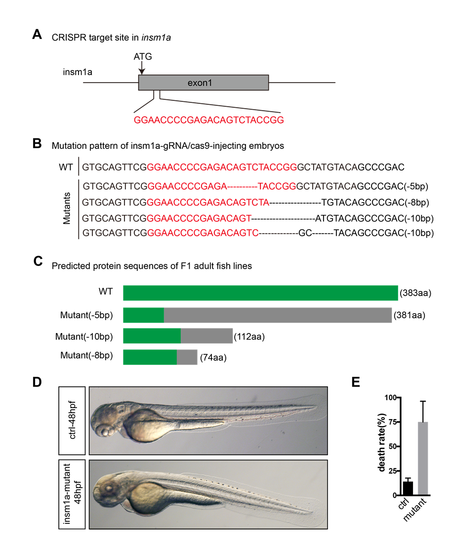
Generation of zebrafish insm1a mutant using CRISPR/Cas9 system. A. Schematic diagram showing the targeting site of the sgRNA on the first exon of insm1a gene. Starting codon (ATG) site is indicated by arrow. B. Mutation pattern of insm1a-gRNA/cas9-injecting embryos. Numbers in the brackets show the numbers of nucleotides were deleted (−). C. Schematic diagram showing the predicted proteins encoded by the three mutated alleles. The mutants are reading frameshift mutations that result in truncated proteins. The gray rectangles indicate the wrong coded amino acid sequences. D. The imaging analysis of insm1a mutant and wide type zebrafish at 48 hpf in bright field. E. Death rate of zebrafish embryos in control group and insm1a mutant groups at 15dpf. PHENOTYPE:
|
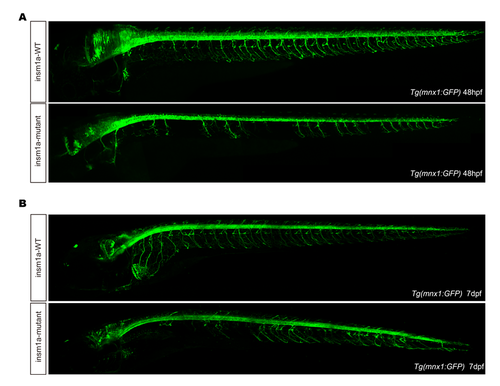
Confocal imaging analysis of of insm1a mutant Tg(mnx1:GFP)ml2 transgenic zebrafish at 48 hpf and 7 dpf. |
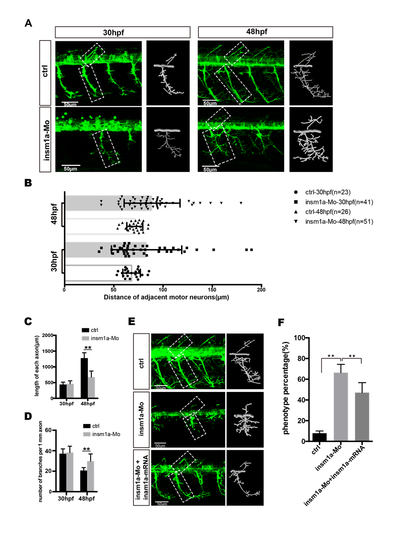
Primary motor neuron developmental defects in the insm1a morphants. A. Confocal imaging analysis of primary motor neuron in control group and insm1a morpholino injected groups at 30 hpf and 48 hpf Tg(mnx1:GFP)ml2. Caps in dash line are showed in diagrams. Scale bar = 50 μ m. B. Quantification of distance between adjacent motor neurons (μm) in control group and insm1a morpholino injection groups at 30 hpf (n=23 and 41 respectively) and 48 hpf (n=26 and 51 respectively). C and D. The length and branching number of Cap axons in control group and insm1a morphant groups at 30 hpf and 48 hpf. Asterisks above the bars are significantly different (P<0.05). Values with ** above the bars are significantly different (P<0.05). E. Abnormal Caps in insm1a knockdown zebrafish embryos were restored by co-injection of insm1a mRNA with the morpholino. F. Quantification of zebrafish embryos with abnormal Caps. |
|
ZFIN is incorporating published figure images and captions as part of an ongoing project. Figures from some publications have not yet been curated, or are not available for display because of copyright restrictions. EXPRESSION / LABELING:
PHENOTYPE:
|
|
Unillustrated author statements PHENOTYPE:
|