
|
Fig. S2
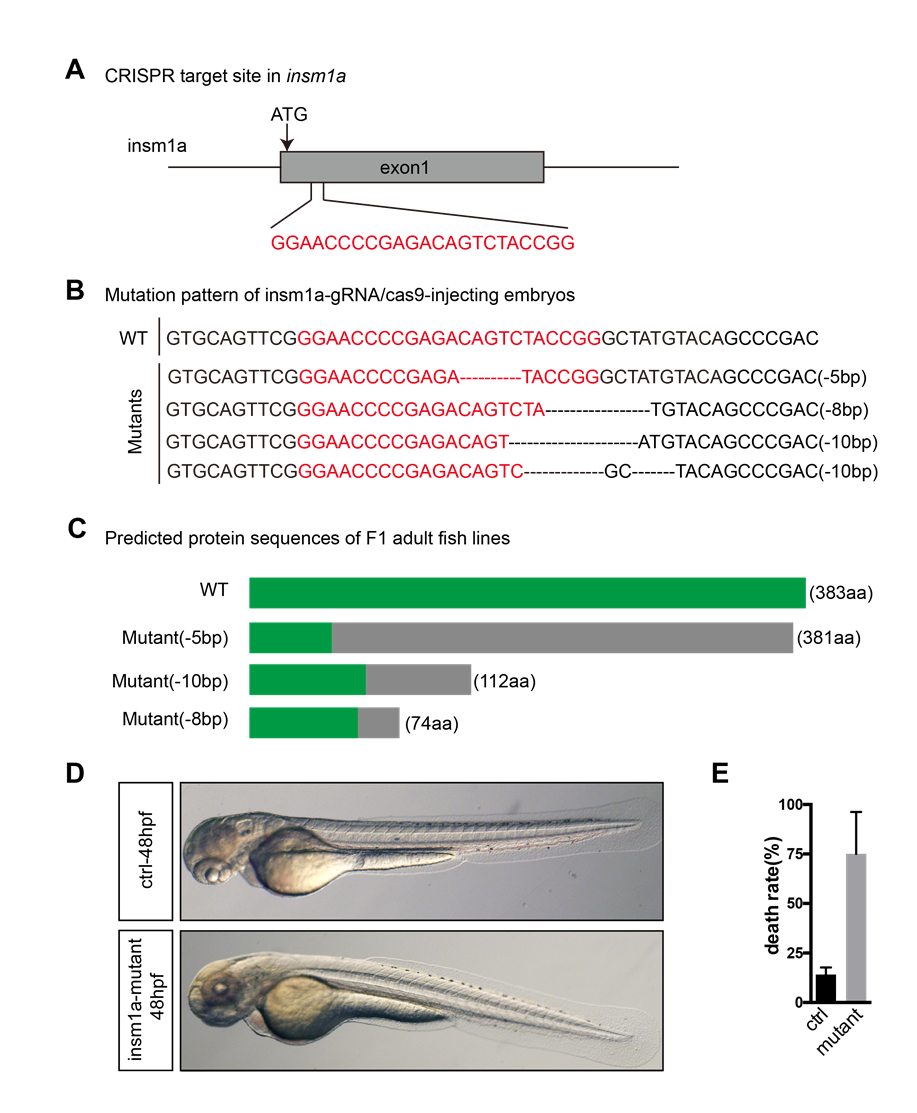
Generation of zebrafish insm1a mutant using CRISPR/Cas9 system. A. Schematic diagram showing the targeting site of the sgRNA on the first exon of insm1a gene. Starting codon (ATG) site is indicated by arrow. B. Mutation pattern of insm1a-gRNA/cas9-injecting embryos. Numbers in the brackets show the numbers of nucleotides were deleted (−). C. Schematic diagram showing the predicted proteins encoded by the three mutated alleles. The mutants are reading frameshift mutations that result in truncated proteins. The gray rectangles indicate the wrong coded amino acid sequences. D. The imaging analysis of insm1a mutant and wide type zebrafish at 48 hpf in bright field. E. Death rate of zebrafish embryos in control group and insm1a mutant groups at 15dpf.