
Fig. 3
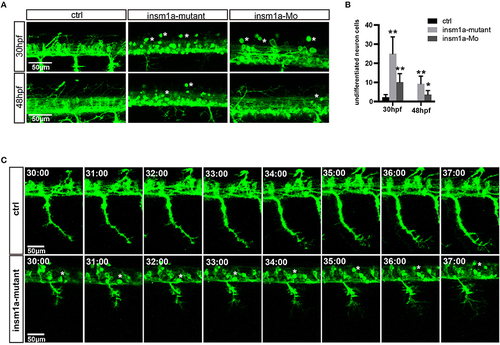
Insm1a deficiency suppressed neuronal cells differentiation. (A) Confocal imaging analysis of primary motor neuron in control group, insm1a mutant group and morphant group at 30 and 48 hpf Tg(mnx1:GFP)ml2. Phenotypes of neuronal cells in the spinal cord in control group, morphant group, and insm1a mutant groups at 30 hpf and 48 hpf. Asterisks indicate undifferentiated neuronal cells. Scale bar = 50 μm. (B) Quantification of the undifferentiated neuronal cell in the insm1a different treatment zebrafish. Asterisks above the bars indicate significant differences (*P < 0.05, **P < 0.01). (C) Time-lapse imaging analysis of the primary motor neuron in control group and insm1a mutant groups. Asterisks represent undifferentiated neuronal cells. Scale bar = 50 μm |
| Fish: | |
|---|---|
| Knockdown Reagents: | |
| Observed In: | |
| Stage Range: | Prim-15 to Long-pec |