
Fig. 2
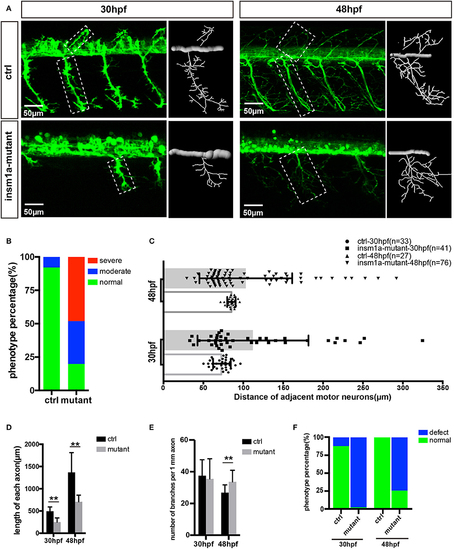
Primary motor neuron morphogenesis defects in the insm1a mutant zebrafish embryos. (A) Confocal imaging analysis of primary motor neuron in control group and insm1a mutant groups at 30 hpf and 48 hpf Tg(mnx1:GFP)ml2. Caps in dash line are showed in diagrams. Scale bar = 50 μm. (B) Quantification of zebrafish embryos with abnormal Caps. The zebrafish embryos are classified into three categories according to its loss degree: severe group with over 80% loss of Cap primary motor neuron, moderate group with <80% loss, and normal group with <20% loss. (C) Quantification of distance between adjacent motor neurons (μm) in control group and insm1a mutant groups at 30 hpf (n = 33 and 41 respectively) and 48 hpf (n = 27 and 76 respectively). (D,E) The length and branching number of Cap axons in control group and insm1a mutant groups at 30 and 48 hpf. Asterisks above the bars indicate significant differences (**P < 0.01). (F) Quantification of zebrafish embryos with abnormal Caps at 30 and 48 hpf. |
| Fish: | |
|---|---|
| Knockdown Reagent: | |
| Observed In: | |
| Stage Range: | Prim-15 to Long-pec |