
- Title
-
Differential actinodin1 regulation in zebrafish and mouse appendages
- Authors
- Lalonde, R.L., Moses, D., Zhang, J., Cornell, N., Ekker, M., Akimenko, M.A.
- Source
- Full text @ Dev. Biol.
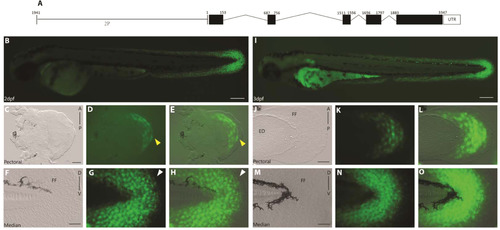
A 2 kb genomic fragment upstream of the first exon of and1 (2P) is sufficient to recapitulate endogenous and1 expression in zebrafish embryonic fin folds. (A) Actinodin1gene organization, 2Pand1 element (1941-1 b.p.) on left, black boxes represent exons, lines represent introns and 5′ upstream genomic region. (B-H) 2 d.p.f. and (I-O) 3 d.p.f. Tg(2Pand1:eGFP) transgenic reporter line. Pectoral (C-E, J-L) and median (F-H, M-O) fin fold display reporter expression in the ectodermal and mesenchymal cell populations. Note the absence of expression in the early pectoral fin fold at 2 d.p.f. (indicated by the yellow arrowheads) (D, E). Expression is also absent from the distal most cells of the median fin fold (indicated by the white arrowheads) (G-H). Note GFP expression in ectodermal cells masks GFP expression in the mesenchymal cells. GFP expression in mesenchymal cells is best observed with transient expression highlighted in Fig. S2 or with confocal imaging. Brightfield, (C, F, J, M), fluorescence (B, D, G, I, K, N), and brightfield/fluorescence merged images (E, H, L, O). FF, Fin Fold; ED, Endoskeletal Disc; A, Anterior; P, Posterior; D, Dorsal; V, Ventral. Scale bars: 200 µm in B, I; 50 µm in C-H, J-O. |
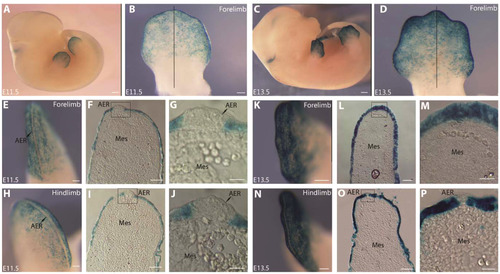
The zebrafish 2P element drives lacZ reporter expression in the ectodermal cells only of the mouse fore- and hindlimb buds. (A, B, E-J) E11.5, (C, D, K-P) E13.5 Tg(2Pand1::LacZ) transgenic mouse embryos. Fore- (B, E-G, K-M) and hindlimb (D, H-J, N-P) buds are presented for E11.5 and E13.5. Ventral close up of forelimb at E11.5 (B) and E13.5 (D). Limbs were sectioned along the proximal distal axis indicated by the black line (B, D). Note the presence of reporter expression in the ectodermal cells only. Note both limbs show an absence of expression in the AER at E11.5 (indicated by the yellow arrowheads) (E-G, H-J). In contrast, at E13.5, lacZ expression is present in the entire distal ectoderm of the forelimb bud (K-M), visualizing AER regression. Cross sections of fore- (F-G, L-M) and hindlimb (I-J, O-P) bud reveal an absence of reporter expression in the mesenchymal tissues at all stages. Note: Brain expression (A, C) is limited to this transgenic line, and is likely ectopic due to the transgene insertion site. AER, Apical Ectodermal Ridge, Mes, Mesenchyme. Scale bars: 1000 µm in A, D; 320µm in B, D; 200 µm in E, H; 400 µm in K; 500 µm in N; 100 µm in F, I; 30 µm in G, J; 100 µm in L; 60 µm in O; 50 µm in M; 30 µm in P. |
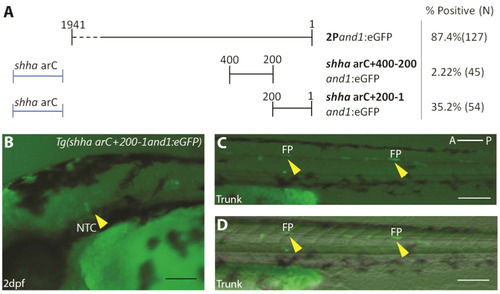
Upstream fragment 200-1and1 contains a promoter. (A) Identification of the promoter region. Two 200 b.p. regions (200-1and1 and 400-200and1) were tested for promoter activity using the shha ar-C enhancer region. % Positive represents percentage of embryos with notochord or floor plate expression, N=Number of total viable injected embryos. (B-D) transient expression of Tg(shha ar-C+200-1and1:eGFP) in embryos at 2 d.p.f. Notochord (B) and floor plate cells (C, D) (indicated by yellow arrowheads) display reporter expression at 2 d.p.f Fluorescence (B, C), and brightfield/fluorescence merged images (D). NTC, Notochord; FP, Floor Plate; A, Anterior; P, Posterior. Scale bars: 200 µm in B-F. |
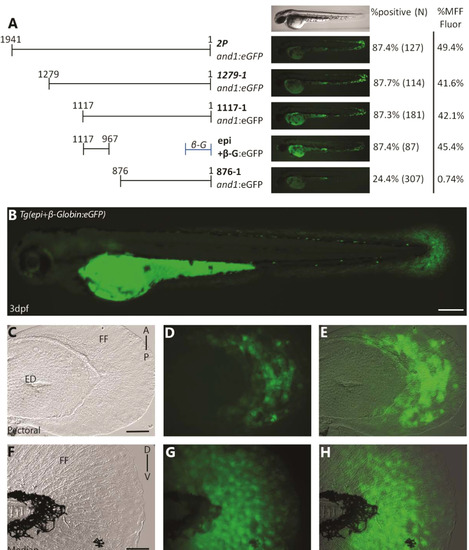
Epi fragment contains an ectodermal enhancer sufficient to recapitulate and1 expression in epithelium of embryonic fin folds. (A) Analysis of truncated 2Pand1 reporter constructs. Constructs were tested for ectodermal enhancer activity. Percentage of eGFP positive embryos during injections, and an average % MFF transient fluorescence coverage are presented on the right (N=Number of total viable injected embryos). Note that the 150 b.p. region 1117-967and1 mimics transient ectodermal enhancer activity of full 2Pand1 element, when tested with the β-globin minimal promoter. Note the reduced percentages for Tg(876and1:eGFP) suggesting the absence of the ectodermal enhancer. (B-H) Tg(epi+β-globin:eGFP) transgenic reporter line at 3 d.p.f. Median (F-H) and pectoral fin fold (C-E) display reporter expression in the ectodermal cells only. Absence of mesenchymal expression is best observed using confocal microscopy. Brightfield (C, F), fluorescence (B, D, G), and brightfield/fluorescence merged images (E, H). ED, Endoskeletal Disc; FF, Fin Fold; A, Anterior; P, Posterior; D, Dorsal; V, Ventral. Scale bars: 200 µm in B; 50 µm in C-H. |
Multiple mesenchymal enhancers exist and are required simultaneously to recapitulate and1 expression in mesenchymal cells of embryonic fin folds. (A) Analysis of truncated 2Pand1 reporter constructs. Constructs were tested for mesenchymal enhancer activity. Percentage of eGFP positive embryos during injections, and an average number of mesenchymal cells are presented on the right (N=Number of total viable injected embryos). Note the reduced percentages with Tg(1941-1117+β-globin:eGFP) and Tg(967and1:eGFP) constructs suggesting both fragments are required for full mesenchymal expression. (B-H) Tg(2PΔepi:eGFP) transgenic reporter line at 3 d.p.f. Median (F-H) and pectoral fin fold (C-E) display reporter expression in the mesenchymal cells only using the 1941-1117and1 and 967and1 fragments simultaneously. Note the higher number of eGFP-positive cells in the posterior half of the pectoral fin (D), indicated by the white arrowhead. Brightfield (C, F), fluorescence (B, D, G), and brightfield/fluorescence merged images (E, H). ED, Endoskeletal Disc; FF, Fin Fold; A, Anterior; P, Posterior; D, Dorsal; V, Ventral. Scale bars: 200 µm in B; 50 µm in C-H. |
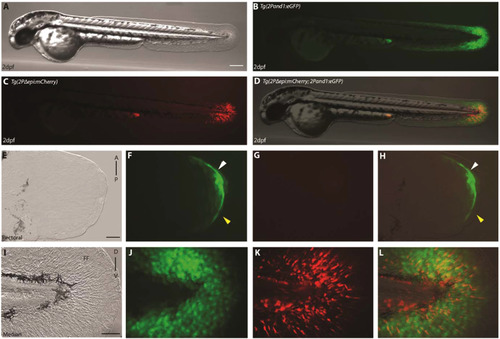
Reporter expression begins in ectodermal cells prior to mesenchymal cells in the pectoral fin folds. (A-L) double transgenic reporter line Tg(2Pand1:eGFP; 2PΔepi:mCherry) at 2 d.p.f., allowing visualization of the ectodermal- and mesenchymal-expressing cells simultaneously. Despite the presence of mesenchymal expression within Tg(2Pand1:eGFP), this line was used to assess ectodermal reporter expression to ensure all potential cis-regulatory elements are included. Tg(2Pand1:eGFP) reporter expression in ectodermal cells and mesenchymal cells are presented in green (B, F, J), Tg(2Pepi:mCherry) reporter expression in mesenchymal cells are presented in red (C, G, K). Ectodermal and mesenchymal images are merged (D, H, L) to visualize ectodermal eGFP and mesenchymal mCherry expression simultaneously. Reporter expression in ectodermal (J, L) and mesenchymal (K, L) cells is present in the median fin fold at 2 d.p.f. In contrast, the pectoral fin fold displays reporter expression in the epithelium only at 2 d.p.f. (indicated by the white arrowheads) (F-H). Note again, the absence of reporter expression in the early pectoral fin fold (indicated by the yellow arrowheads) (F, H). Tip of the yolk sac extension displays autofluorescence (B-D). A, Anterior; P, Posterior; D, Dorsal; V, Ventral. Scale bars: 300 µm in A-D; 30 µm in E-H; 50 µm in I-L. |
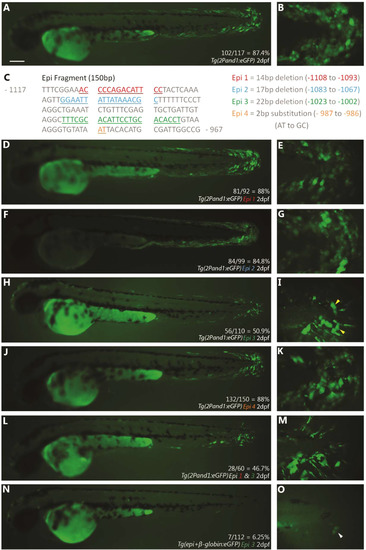
Epi site 3 contains important sequences for ectodermal reporter expression in embryonic fin folds. (A, B) unmutated Tg(2Pand1:eGFP) transient expression at 2 d.p.f. The rate of GFP positive embryos is indicated (A), and higher magnification of the median fin fold of representative fish is shown (B). (C) Four different mutations were tested within the Epi fragment for ectodermal enhancer activity to identify candidate ectodermal enhancer sites. Mutation locations are colour coded, and the mutation details are described on the right. Only embryos with visible ectodermal expression were counted as “GFP positive”. (D-O) GFP expression observed with the mutated constructs. Epi mutations 1 (D,E), 2 (F,G), and 4 (J,K) display similar rates of GFP positive embryos and levels of ectodermal expression in the median fin fold compared to unmutated Tg(2Pand1:eGFP) injections. Epi mutation 3 (H, I) yields a decreased rate of GFP positive embryos (50.9%), and lower levels of ectodermal expression in the median fin fold (indicated by yellow arrowheads) (I). Epi mutations 1 and 3 tested in combination (L, M) yield no synergistic effects. (N-O) Epi 3 mutation was tested in the Tg(epi+β-globin:eGFP) construct and displayed a drastic decrease in GFP positive embryos (6.25%), and a nearly complete loss of ectodermal reporter expression (indicated by the white arrowhead) (O). Scale bars: 200 µm in A, D, F, H, J, L, N; 20 µm in B, E, G, I, K, M, O. |
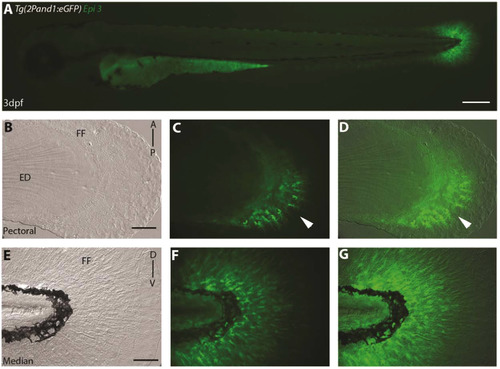
Epi site 3 required for epithelial reporter expression in Tg(2Pand1:eGFP). (A-G) 3 d.p.f. Tg(2Pand1:eGFP) epi site 3 transgenic reporter line. Ectodermal expression is completely lost with the removal of the epi site 3 23 b.p. fragment (A-G). Median (E-G) and pectoral fin fold (B-D) display reporter expression in the mesenchymal cells identical to Tg(2PΔepi:eGFP) transgenic line. Note the higher number of eGFP-positive cells in the posterior half of the pectoral fin fold (B, C). Brightfield (B, E), fluorescence (A, C, F), and brightfield/fluorescence merged images (D, G). ED, Endoskeletal Disc; FF, Fin Fold; A, Anterior; P, Posterior; D, Dorsal; V, Ventral. Scale bars: 200 µm in A; 50 µm in B-G. |
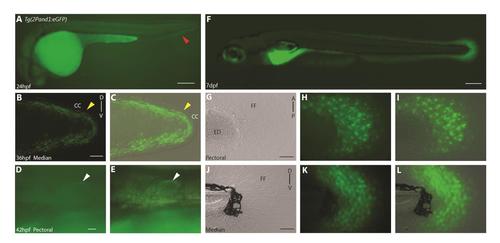
A 2 kb genomic fragment upstream of the first exon of and1 (2P) is sufficient to recapitulate endogenous and1 expression zebrafish embryonic fin folds. (A) 24 h.p.f., (B, C) 36 h.p.f, (D-E) 42 h.p.f, (F-L) 7d.p.f. Tg(2Pand1:eGFP) transgenic reporter line. Median fin fold displays reporter expression in the ectodermal cells beginning around 24 h.p.f. (indicated by the red arrowhead) (A). The pectoral fin fold displays reporter expression in the ectodermal cells beginning around 42 h.p.f. (indicated by the white arrowheads) (D-E). 7 d.p.f. transgenic larvae display reporter expression in both ectodermal and mesenchymal cells (F-L). Note the absence of reporter expression in the cleft cells of the median fin fold at 36 h.p.f. (indicated by yellow arrowheads) (B, C). Reminder, mesenchymal GFP expression is masked by ectodermal GFP expression, refer to Fig.. S2 or Mov. S1. Brightfield (G, J), fluorescence (A, B, D, F, H, K), and brightfield/fluorescence merged images (C, E, I, L). CC, Cleft Cells; FF, Fin Fold; ED, Endoskeletal Disc; A, Anterior; P, Posterior; D, Dorsal; V, Ventral. Scale bars: 200µm in A; 50µm in B, C; 200µm in F; 50µm in G-I, J-L. |
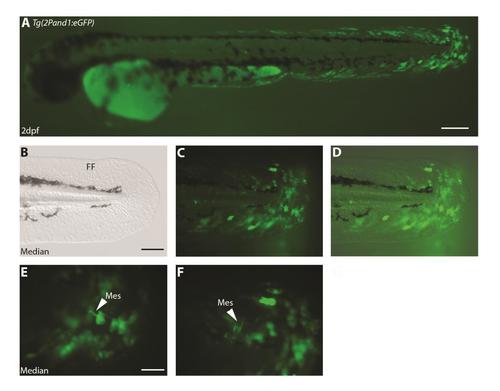
Mosaic ectodermal expression in Tg(2Pand1:eGFP) injected embryos reveal mesenchymal expression. (A-F) Tg(2Pand1:eGFP) transient expression in injected embryos at 2 d.p.f.. Following injection of a DNA construct in zebrafish embryo, expression of the transgene is always mosaic. This allows to visualize GFP expression in some mesenchymal cells (indicated by white arrowheads) due to the mosaic GFP expression in the overlaying ectodermal cells (E, F). Brightfield (B), fluorescence (A, C, E, F), and brightfield/fluorescence merged images (D). FF, Fin fold; Epi , Ectodermal cells; Mes, Mesenchymal cells. Scale bars: 200µm in A; 100µm in B-D; 50µm in E, F. |
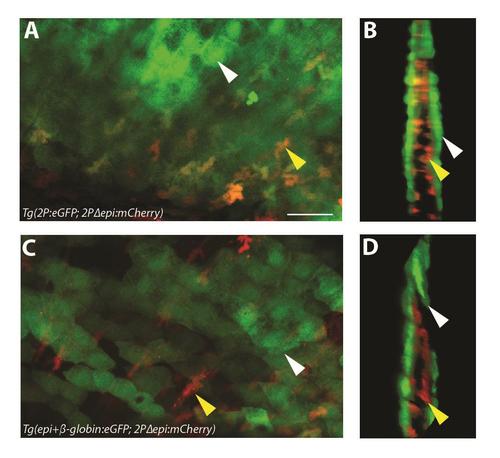
Tg(2Pand1:eGFP) displays epithelial and mesenchymal reporter expression, Tg(epi+β-globin:eGFP) displays only epithelial reporter expression. (A-B) Tg(2P:eGFP; 2PΔepi:mCherry) and (C-D) Tg(epi+β-globin:eGFP; 2PΔepi:mCherry) 3 d.p.f. median fin fold using confocal microscopy. Z-stack (A, C) and 3D reconstruction (B, D) images are shown. Tg(2P:eGFP; 2PΔepi:mCherry) double transgenic line displays eGFP in both ectodermal and mesenchymal cells (A-B). Note the orange/yellow colour of all mesenchymal cells, indicating co-expression of eGFP and mCherry (A-B). Tg(epi+β-globin:eGFP; 2PΔepi:mCherry) double transgenic line displays eGFP in ectodermal cells only (C-D). Note the red colour of all mesenchymal cells, indicating absence of any eGFP expression (C-D). Representative ectodermal cells are highlighted by the white arrow (A-D), and representative mesenchymal cells are highlighted by the yellow arrow (A-D). Scale bars: 25µm in A-D. |
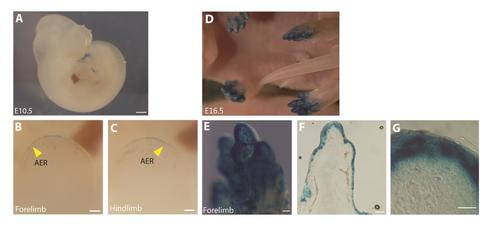
The 2Pand1 regulatory element is driving reporter expression in mouse limb ectoderm. (A-C) E10.5 and (D-G) E16.5 Tg(2Pand1::LacZ) transgenic mouse embryos. Whole embryos are presented at E10.5, and E16.5 (A, D). Whole limbs are included for E10.5, and E16.5 (B-C, E), sections are presented for E16.5 (F-G). Reporter expression is visible in the distal ectoderm of the fore- and hindlimb beginning at E10.5, with the exception of the AER (indicated by the yellow arrowheads) (A-C). By E16.5, reporter expression is presented in the entire distal ectoderm (D-G). Note the absence of reporter expression in the mesenchymal tissues at all developmental stages (B-C, F-G). AER, Apical Ectodermal Ridge. Scale bars: 1000µm in A, D; 200µm in B, C; 200µm in E; 200µm in F; 50µm in G. |
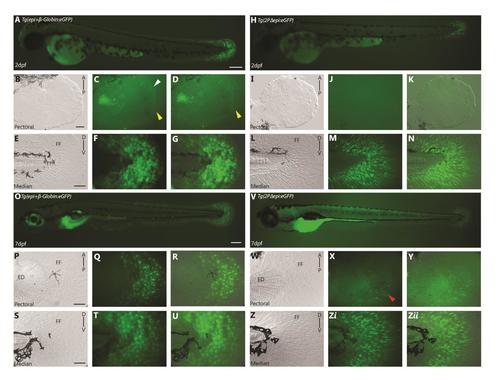
Tg(epi+β-globin:eGFP) and Tg(2PΔepi:eGFP) together recapitulate endogenous and1 expression zebrafish embryonic fin folds. (A-G) 2 d.p.f., (O-U) 7 d.p.f. Tg(epi+β-globin:eGFP) transgenic reporter line. (H-N) 2 d.p.f , (V-Zii) 7 d.p.f Tg(2PΔepi:eGFP) transgenic reporter line. Ectodermal (E-G) and mesenchymal (L-M) expression is present in the median fin fold at 2 d.p.f.. Only ectodermal expression is present in the pectoral fin fold at 2 d.p.f. (indicated by the white arrowhead) (C). Note again, the absence of ectodermal expression in the early pectoral fin fold (indicated by the yellow arrowhead) (B-D). Ectodermal (P-U) and mesenchymal (W-Zii) reporter expression is present in the pectoral and median fin fold at 7 d.p.f.. Together these two lines recapitulate and1 expression. Note the stronger mesenchymal expression in the posterior half of the pectoral fin fold (indicated by the red arrowhead) (X). Brightfield (B, E, I, L, P, S, W, Z), fluorescence (A, C, F, H, J, M, O, Q, T, V, X, Zi), and brightfield/fluorescence merged images (D, G, K, N, R, U, Y, Zii). FF, Fin Fold; ED, Endoskeletal Disc; A, Anterior; P, Posterior; D, Dorsal; V, Ventral. Scale bars: 200µm in A, H, O, V; 30µm in B-D, I-K; 50µm in P-R, W-Y, E-G, L-N, S-U, Z-Zii. |
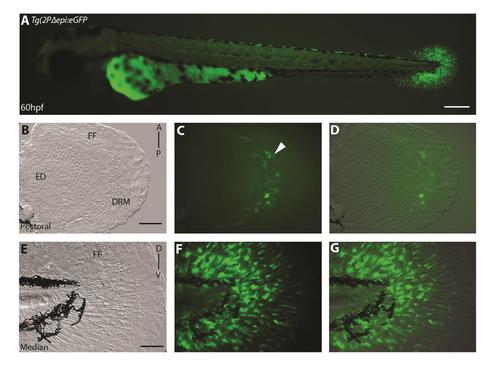
Symmetrical GFP-expressing cells in distal rim mesenchyme at 60 h.p.f. (A-G) 60 h.p.f. in Tg(2PΔepi:eGFP) transgenic reporter line. Mesenchymal expression is present in both the median fin fold (E-G) and the pectoral fin fold (B-D) at 60 h.p.f.. The distal rim mesenchyme of the pectoral fin bud symmetrical reporter expression (C-D). Brightfield (B, E), fluorescence (C-F), and brightfield/fluorescence (D-G) merged images. FF, Fin Fold; ED, Endoskeletal Disc, A, Anterior; P, Posterior; D, Dorsal; V, Ventral. Scale bars: 200µm in A, 50µm in B-G. |
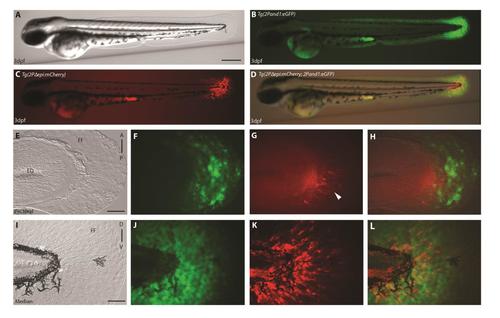
Reporter expression present in ectodermal and mesenchymal tissues in 3 d.p.f median and pectoral fin folds. (A-L) Double transgenic reporter line Tg(2Pand1:eGFP; 2PΔepi:mCherry) at 3 d.p.f., allowing visualization of the ectodermal- and mesenchymal-expressing cells simultaneously. Despite the presence of mesenchymal expression within Tg(2Pand1:eGFP), this line was used to assess ectodermal reporter expression to ensure all potential cis-regulatory elements are included. Tg(2Pand1:eGFP) reporter expression in ectodermal cells and mesenchymal cells are presented in green (B, F, J), Tg(2PΔepi:mCherry) reporter expression in mesenchymal cells are presented in red (C, G, K). Ectodermal and mesenchymal images are merged (D, H, L). Ectodermal and mesenchymal images are merged (D, H, L) to visualize ectodermal eGFP and mesenchymal mCherry expression simultaneously. By 3 d.p.f, ectodermal and mesenchymal expression is present in the median and pectoral fin fold (A-L). Note the stronger mesenchymal expression in the posterior half of the pectoral fin fold (indicated by the white arrowhead) (G). Tip of the yolk sac extension displays autofluorescence (B-D). ED, Endoskeletal Disc; FF, Fin Fold; A, Anterior; P, Posterior; D, Dorsal; V, Ventral. Scale bars: 300µm in A-D, 50µm in E-L. |
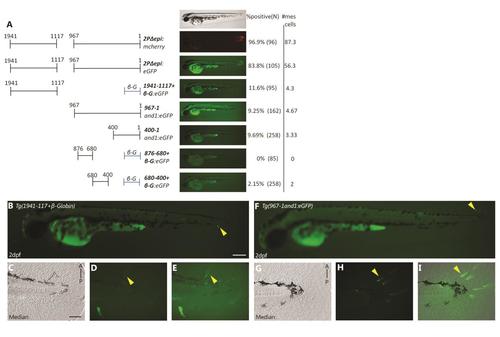
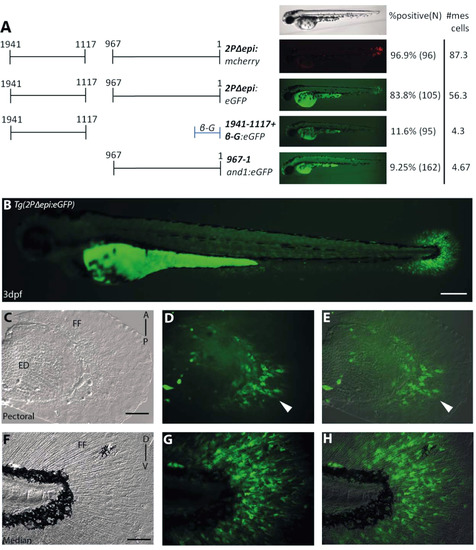
Full analysis for mesenchymal enhancer activity: multiple mesenchymal enhancers exist and are required simultaneously to recapitulate and1 mesenchymal cells in embryonic fin folds. (A) Transient expression analysis of truncated 2Pand1 reporter constructs in injected embryos. Constructs were tested for mesenchymal enhancer activity. Percentage of GFP positive embryos during injections, and an average number of mesenchymal cells are presented on the right (N = Number of total viable injected embryos). Note the reduced percentages of GFP positive embryos with the Tg(1941-1117+ β-globin:eGFP) and Tg(967-1and1:eGFP) constructs suggesting that both fragments are required for full mesenchymal expression (A). Note the even more reduced percentages obtained with smaller fragments Tg(400-1and1:eGFP), Tg(876-680+ β-globin:eGFP), Tg(680-400+β-globin:eGFP) (A). (B-E) Transient expression of Tg(1941-1117and1:eGFP) at 2 d.p.f. (F-I) Transient expression of Tg(967-1and1:eGFP) at 2 d.p.f. Neither fragment is capable of mimicking the expression of Tg(2PΔepi:eGFP). Note the very small amount of reporter expressing mesenchymal cells (indicated by yellow arrowheads) (B, D-E, F, H-I). Brightfield (C, G), fluorescence (B, D, F, H), and brightfield/fluorescence merged images (E, I). A, Anterior; P, Posterior; D, Dorsal; V, Ventral. Scale bars: 200µm in A-E; 50µm in B-D, F-H. |
Reprinted from Developmental Biology, 417(1), Lalonde, R.L., Moses, D., Zhang, J., Cornell, N., Ekker, M., Akimenko, M.A., Differential actinodin1 regulation in zebrafish and mouse appendages, 91-103, Copyright (2016) with permission from Elsevier. Full text @ Dev. Biol.