
Fig. 1
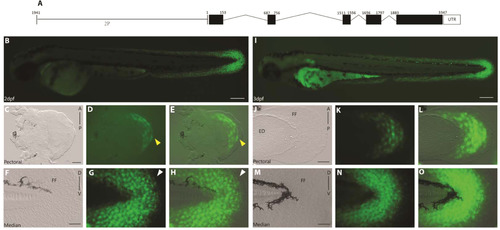
A 2 kb genomic fragment upstream of the first exon of and1 (2P) is sufficient to recapitulate endogenous and1 expression in zebrafish embryonic fin folds. (A) Actinodin1gene organization, 2Pand1 element (1941-1 b.p.) on left, black boxes represent exons, lines represent introns and 5′ upstream genomic region. (B-H) 2 d.p.f. and (I-O) 3 d.p.f. Tg(2Pand1:eGFP) transgenic reporter line. Pectoral (C-E, J-L) and median (F-H, M-O) fin fold display reporter expression in the ectodermal and mesenchymal cell populations. Note the absence of expression in the early pectoral fin fold at 2 d.p.f. (indicated by the yellow arrowheads) (D, E). Expression is also absent from the distal most cells of the median fin fold (indicated by the white arrowheads) (G-H). Note GFP expression in ectodermal cells masks GFP expression in the mesenchymal cells. GFP expression in mesenchymal cells is best observed with transient expression highlighted in Fig. S2 or with confocal imaging. Brightfield, (C, F, J, M), fluorescence (B, D, G, I, K, N), and brightfield/fluorescence merged images (E, H, L, O). FF, Fin Fold; ED, Endoskeletal Disc; A, Anterior; P, Posterior; D, Dorsal; V, Ventral. Scale bars: 200 µm in B, I; 50 µm in C-H, J-O. |
Reprinted from Developmental Biology, 417(1), Lalonde, R.L., Moses, D., Zhang, J., Cornell, N., Ekker, M., Akimenko, M.A., Differential actinodin1 regulation in zebrafish and mouse appendages, 91-103, Copyright (2016) with permission from Elsevier. Full text @ Dev. Biol.