
Fig. 3
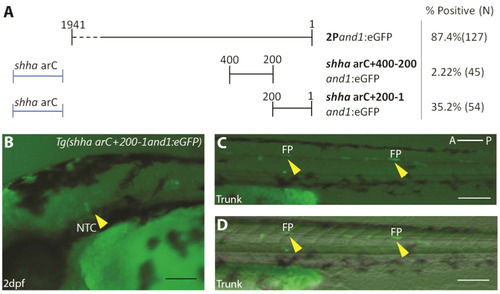
Upstream fragment 200-1and1 contains a promoter. (A) Identification of the promoter region. Two 200 b.p. regions (200-1and1 and 400-200and1) were tested for promoter activity using the shha ar-C enhancer region. % Positive represents percentage of embryos with notochord or floor plate expression, N=Number of total viable injected embryos. (B-D) transient expression of Tg(shha ar-C+200-1and1:eGFP) in embryos at 2 d.p.f. Notochord (B) and floor plate cells (C, D) (indicated by yellow arrowheads) display reporter expression at 2 d.p.f Fluorescence (B, C), and brightfield/fluorescence merged images (D). NTC, Notochord; FP, Floor Plate; A, Anterior; P, Posterior. Scale bars: 200 µm in B-F. |
Reprinted from Developmental Biology, 417(1), Lalonde, R.L., Moses, D., Zhang, J., Cornell, N., Ekker, M., Akimenko, M.A., Differential actinodin1 regulation in zebrafish and mouse appendages, 91-103, Copyright (2016) with permission from Elsevier. Full text @ Dev. Biol.