
Fig. S3
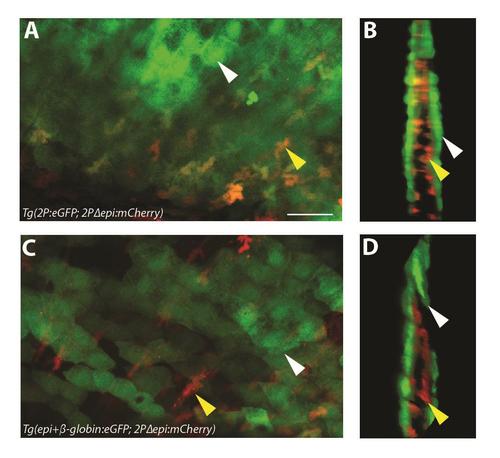
Tg(2Pand1:eGFP) displays epithelial and mesenchymal reporter expression, Tg(epi+β-globin:eGFP) displays only epithelial reporter expression. (A-B) Tg(2P:eGFP; 2PΔepi:mCherry) and (C-D) Tg(epi+β-globin:eGFP; 2PΔepi:mCherry) 3 d.p.f. median fin fold using confocal microscopy. Z-stack (A, C) and 3D reconstruction (B, D) images are shown. Tg(2P:eGFP; 2PΔepi:mCherry) double transgenic line displays eGFP in both ectodermal and mesenchymal cells (A-B). Note the orange/yellow colour of all mesenchymal cells, indicating co-expression of eGFP and mCherry (A-B). Tg(epi+β-globin:eGFP; 2PΔepi:mCherry) double transgenic line displays eGFP in ectodermal cells only (C-D). Note the red colour of all mesenchymal cells, indicating absence of any eGFP expression (C-D). Representative ectodermal cells are highlighted by the white arrow (A-D), and representative mesenchymal cells are highlighted by the yellow arrow (A-D). Scale bars: 25µm in A-D. |
Reprinted from Developmental Biology, 417(1), Lalonde, R.L., Moses, D., Zhang, J., Cornell, N., Ekker, M., Akimenko, M.A., Differential actinodin1 regulation in zebrafish and mouse appendages, 91-103, Copyright (2016) with permission from Elsevier. Full text @ Dev. Biol.