
|
Fig. S1
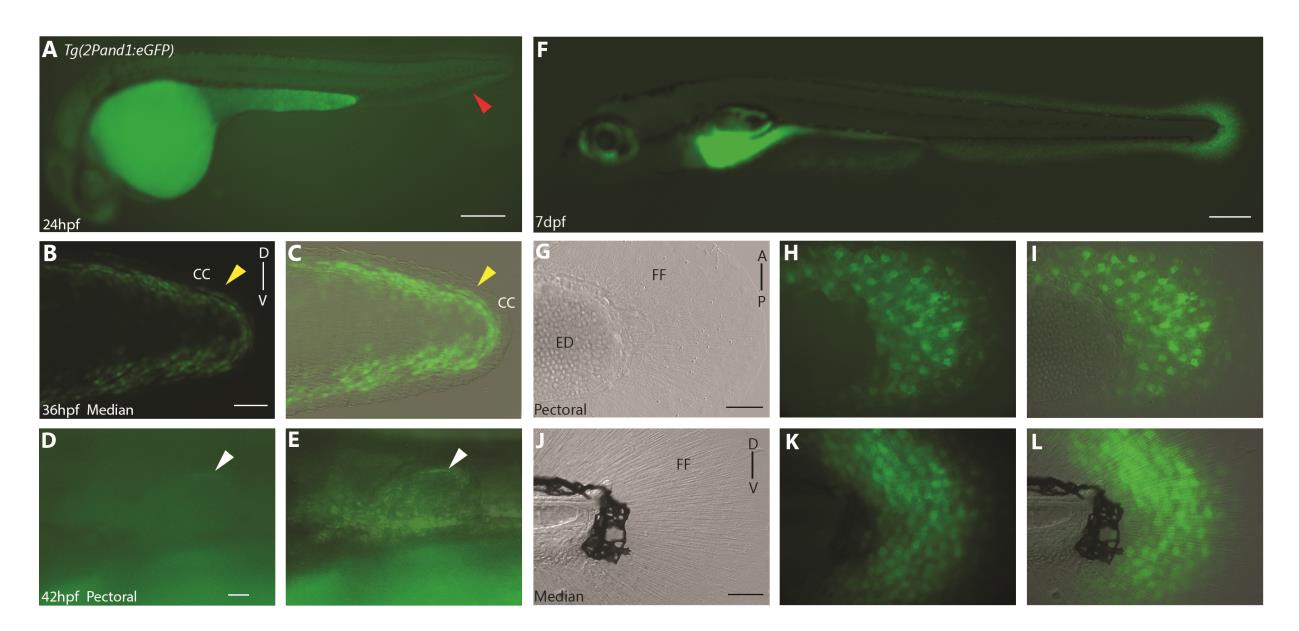
A 2 kb genomic fragment upstream of the first exon of and1 (2P) is sufficient to recapitulate endogenous and1 expression zebrafish embryonic fin folds. (A) 24 h.p.f., (B, C) 36 h.p.f, (D-E) 42 h.p.f, (F-L) 7d.p.f. Tg(2Pand1:eGFP) transgenic reporter line. Median fin fold displays reporter expression in the ectodermal cells beginning around 24 h.p.f. (indicated by the red arrowhead) (A). The pectoral fin fold displays reporter expression in the ectodermal cells beginning around 42 h.p.f. (indicated by the white arrowheads) (D-E). 7 d.p.f. transgenic larvae display reporter expression in both ectodermal and mesenchymal cells (F-L). Note the absence of reporter expression in the cleft cells of the median fin fold at 36 h.p.f. (indicated by yellow arrowheads) (B, C). Reminder, mesenchymal GFP expression is masked by ectodermal GFP expression, refer to Fig.. S2 or Mov. S1. Brightfield (G, J), fluorescence (A, B, D, F, H, K), and brightfield/fluorescence merged images (C, E, I, L). CC, Cleft Cells; FF, Fin Fold; ED, Endoskeletal Disc; A, Anterior; P, Posterior; D, Dorsal; V, Ventral. Scale bars: 200µm in A; 50µm in B, C; 200µm in F; 50µm in G-I, J-L.
Reprinted from Developmental Biology, 417(1), Lalonde, R.L., Moses, D., Zhang, J., Cornell, N., Ekker, M., Akimenko, M.A., Differential actinodin1 regulation in zebrafish and mouse appendages, 91-103, Copyright (2016) with permission from Elsevier. Full text @ Dev. Biol.