
- Title
-
Patterns of thyroid hormone receptor expression in zebrafish and generation of a novel model of resistance to thyroid hormone action
- Authors
- Marelli, F., Carra, S., Agostini, M., Cotelli, F., Peeters, R., Chatterjee, K., Persani, L.
- Source
- Full text @ Mol. Cell. Endocrinol.
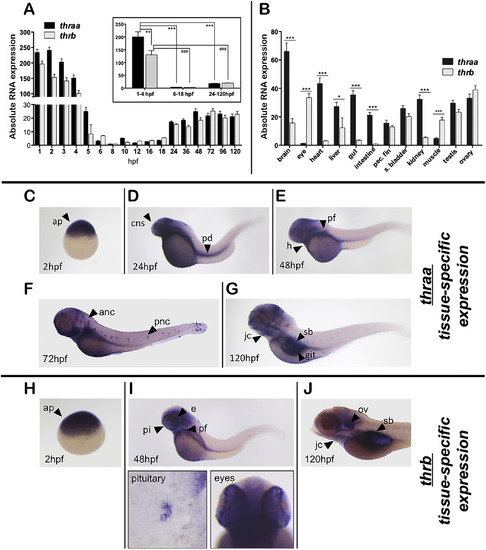
Ontogenetic pattern of thraa and thrb expression in zebrafish. Panel A) qRT-PCR of thraa and thrb absolute mRNAs expression during embryonic development and larval transition (1-120hpf). The average expression of thraa and thrb during the zygote-blastula stage (1-4 hpf), gastrula-segmentation (6-18 hpf) and late embryonic and larval stages (24-120 hpf) are illustrated in the inset. **p < 0.01; ***p < 0.001; ###p < 0.001. Panel B) qRT-PCR of thraa and thrb absolute expression in adult tissues, total RNA was extracted from 5 adults. *p < 0.05; ***p < 0.001. Panels C-J) Tissue-specific expression of TRs, at different developmental stages, analyzed by WISH using thraa or thrb riboprobes followed by NBT/BCIP staining. Images are representative of 3 experiments (50 embryos each). ap: animal pole of the zygote; cns: central nervous system; pd: pronephric ducts; h: heart; pf: pectoral fins; anc: anterior neuromast cells; pnc: posterior neuromast cells; git: gastrointestinal tract; jc: jaw cartilages; sb: swim bladder; e: eyes, pi: pituitary; ov: otic vesicle. |
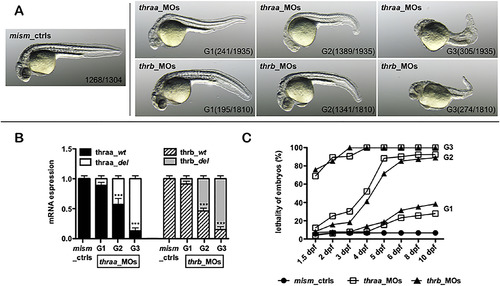
Panel A) Morphological evaluation of phenotypes of embryos injected with thraa or thrb splicing morpholinos (thraa_MOs or thrb_MOs) and comparison with the mismatch controls (mism_ctrls) at 24 hpf. Thraa_MOs: G1, normal/mild phenotype, similar to the mism_ctrls; G2, moderate phenotype (small head, reduced body length and hypopigmentation); G3: severe phenotype. Thrb_MOs: G1, normal/mild phenotype, similar to the mism_ctrls; G2, moderate phenotype (curved/curled tail, notochord abnormalities and hypopigmented eyes); G3: severe phenotype. The number of embryos in each phenotypic group is reported in parenthesis. Images are representative of 3 independent experiments. Panel B) qRT-PCR of wild-type and deleted thraa and thrb mRNA expression after splMOs injection using specific sets of primers (see Materials and Methods for details). ***p < 0.001 vs wild-type zTRs. Panel C) Analysis of lethality during development (from 1.5 to 10 dpf) of thraa_ and thrb_MOs and mism_ctrls. The results are expressed as percentage of 3 independent experiments (100 embryos each). PHENOTYPE:
|
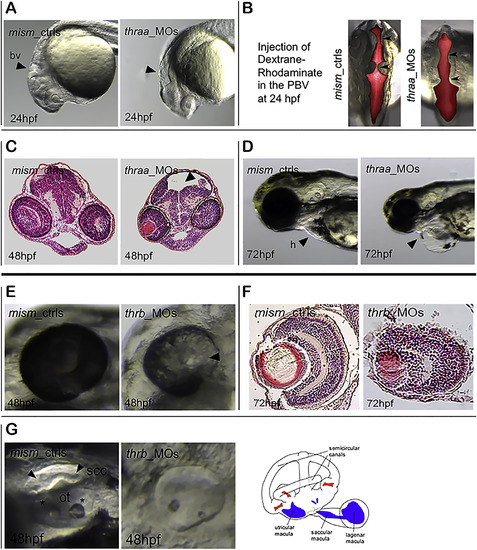
Panels A-D) Morphological defects of thraa _MOs. At 24 hpf, thraa_MOs display small head (Panel A, arrow) and a dilatation of brain ventricles (bv, arrows) with an accumulation of dextrane-rhodaminate dye (dorsal view, Panel B). At 48 hpf, histological sections confirm the hydrocephalus in thraa_MOs (Panel C, arrow). At 72 hpf, the heart (h) edema is visible in thraa_MOs (Panel D, arrow). Panels E-G) Morphological defects of thrb_MOs. At 48 hpf, the thrb_MOs present hypopigmented eyes (Panel E) with a defective development of retina visible in the histological sections at 72 hpf (Panel F). Alterations of the otic vesicle structures in thrb_MOs at 48 hpf (Panel G): ssc, semicircular canals (arrows); ot, otoliths (asterisks). The schematic structure of the otic vesicle is illustrated in the drawing image from Whitfield TT (Whitfield, 2015). PHENOTYPE:
|
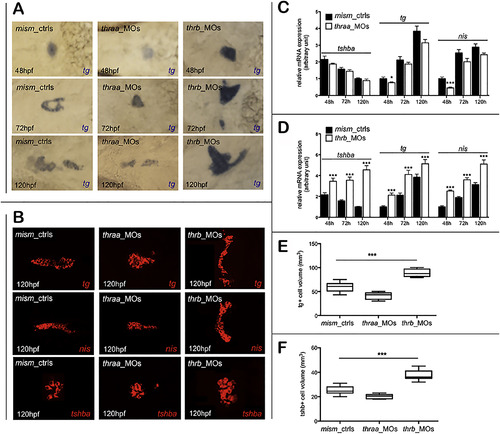
Biochemical evaluation of thyroid development and function. Panel A) Thyroid development of mism_ctrls, thraa_MOs and thrb_MOs, analyzed by WISH with tg riboprobe, followed by Fast Blue staining, in embryos at 48, 72 and 120 hpf. Panel B) WISH/Fast Blue of thyroid (tg, nis) and pituitary (tshba) markers at 120 hpf followed by confocal acquisition. Bright-field and fluorescence images are representative of 3 experiments (20 embryos each, mounted in ventral view) (left-eyes, right-tail). Panels C and D) qRT-PCR of tshba, tg and nis expression at 48, 72 and 120 hpf. The total RNA was extracted from pools of 30 embryos for each time point and the relative mRNA expression was measured and normalized against the housekeeping gene eef1α. Panels E and F) Analysis of thyroid and pituitary cell-volumes (mm3) using Volocity software. *p < 0.05 and ***p < 0.001 vs mism_ctrls. (For interpretation of the references to colour in this figure legend, the reader is referred to the web version of this article.) |
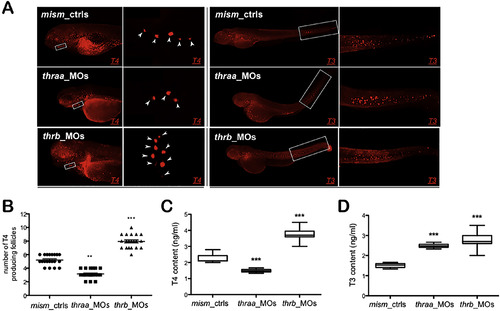
Qualitative and quantitative analysis of TH levels at 120 hpf. Panel A) Immunofluorescence with anti-T4 and anti-T3 antibodies. The T4-positive thyroid follicles are visible in lateral view (square), and in ventral view in the corresponding magnification (arrows). The T3-positive spots and their accumulation in the tail (in the magnification) are visible in lateral view. Panel B) Number of T4-positive thyroid follicles at 120 hpf. Results are expressed as mean ± SD of 20 embryos each. Panels C and D) Quantification of T4 and T3 total concentrations (ng/ml) measured with a specific ELISA kit. **p < 0.01 and ***p < 0.001 vs mism_ctrls. |
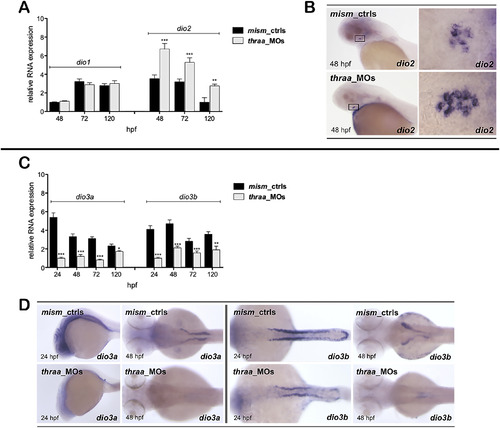
Panels A and C) qRT-PCR of dio1, dio2, dio3a and dio3b expression in mism_ctrls and thraa_MOs at 24-120 hpf. *p < 0.05, **p < 0.01 and ***p < 0.001 vs mism_ctrls. Panel B) WISH of dio2 mRNA expression at 48 hpf: the pituitary dio2-positive cells are visible in lateral view, and in ventral view in the magnification of the corresponding square. Panel D) WISH of dio3a and dio3b mRNAs expression: dio3a is detectable in brain at 24 hpf (lateral view) and pronephric tubules at 48 hpf (dorsal view). The dio3b is also visible in pronephros at 24 and 48 hpf. The images are representative of 3 experiments (30 embryos each). |
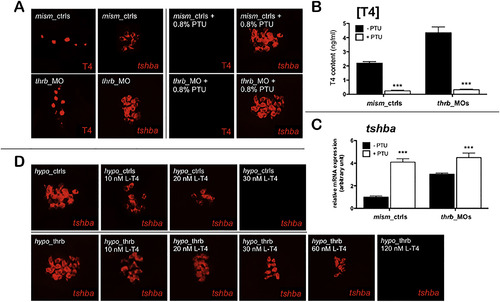
Analysis of the sensitivity of the TH negative feedback mechanism in thrb_MOs. Panel A) Generation of hypothyroid embryos (low T4 and high tshba) from mism_ctrls and thrb_MOs after treatment with 0.8% PTU. IHC of T4 production and WISH/Fast Blue of tshba-positive cells followed by confocal acquisition of embryos at 120 hpf (in ventral view), before and after PTU treatment. Panels B and C) ELISA quantification of T4 content and qRT-PCR of tshba in mism_ctrls and thrb_MOs before and after PTU. ***p < 0.001 vs untreated embryos. Panel D) WISH of tshba expression of the hypo_ctrls and hypo_thrb treated with increasing doses of L-T4 (10-120 nM). (For interpretation of the references to colour in this figure legend, the reader is referred to the web version of this article.) |
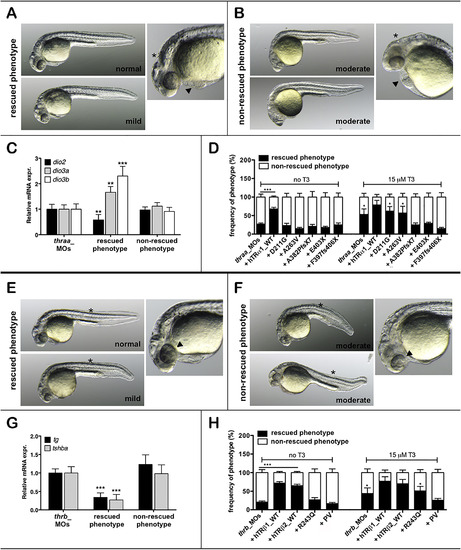
Rescue experiment using human wild-type and mutant TRs. Panels A-D) Embryos were coinjected with 0.6pmol/embryo of thraa splMO +200 pg/embryo of hTRα1_WT or 5 mutant hTRα (D211G (van Guchta et al., 2014), A263V (Moran et al., 2014), A382PfsX7 (Moran et al., 2013), E403X (Bochukova et al., 2012) and F397fs406X (van Mullem et al., 2012)) mRNAs and compared with the thraa_MOs. Panel A: embryos with “rescued phenotype” (normal development or mild defects). Panel B: embryos with “non-rescued phenotype” (moderate defects such as short body length and hypopigmentation, accompanied by cardiac (arrows) and brain edema (asterisks)). Panel C: qRT-PCR of deiodinase expression. The recovery of normal TH metabolism in embryos with rescued phenotype was confirmed by the reduced expression of dio2 and the increased expression of both dio3a and dio3b. **p < 0.01; ***p < 0.001 vs untreated thraa_MOs. Panel D: frequency of injected embryos belonging the two major classes. For each injection, the embryos were subdivided into two pools of 100 embryos each, and treated with DMSO (basal condition) or 15 µM T3 in the harvesting water. Panels E-G) Embryos were coinjected with 0.8pmol/embryo of thrb splMO +200 pg/embryo of hTRβ1_WT or hTRβ2_WT or 2 hTRβ mutant (R243Q (Onigata et al., 1995), PV (Parrilla et al., 1991)) mRNAs and compared with the thrb_MOs. Panel E: embryos with “rescued phenotype” (normal development or mild defects). Panel B: embryos with “non-rescued phenotype” (moderate defects such as curved tail, notochord alterations (asterisks) and eye hypopigmentation (arrows)). Panel G: qRT-PCR of tg and tshba expression. The recovery of normal thyroid function in embryos with reversed phenotype was confirmed by the reduced expression of tg and tshba. ***p < 0.001 vs untreated thrb_MOs. Panel H: frequency of injected embryos (treated with DMSO or 15 µM T3 in the harvesting water) belonging the two major classes. |
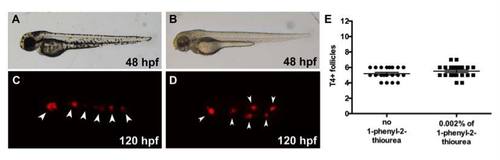
A and B) Comparison of pigmentation at 48 hpf of untreated and treated (0.002% of 1-phenyl-2-thiourea) embryos. C and D) IHC with anti-T4 antibody in untreated and treated larvae at 120 hpf, acquired in ventral view, head to the left. E) Count of the T4-producing follicles of 20 untreated and treated larvae each. |
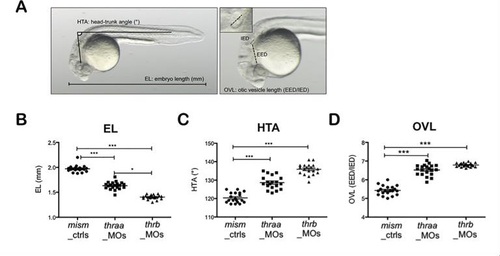
Analysis of embryonic development of thraa_MOs and thrb_MOs. A) Representation of the three developmental parameters in embryos at 24 hpf. EL: embryonic length; HTA: head-trunk angle; OVL: otic vesicle length. The OVL derived from the ratio between the ear and eye distance (EED) and the inner ear diameters (IED) (2). B) Analysis of embryonic development of mism_ctrls, thraa_ and thrb_MOs. Values represent the mean±SD of 20 embryos each. *p<0.05; ***p<0.001. PHENOTYPE:
|
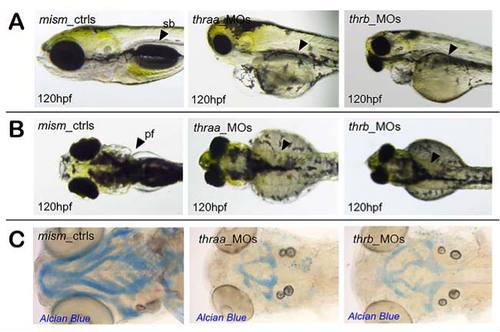
Analysis of larval transition of thraa_MOs and thrb_MOs. Larval transition of mism_ctrls, thraa_MO and thrb_MOs at 120hpf. Panel A in lateral view: formation of an inflated swim bladder (sb). Panel B in dorsal view: development of pectoral fins (pf). Panel C in ventral view: jaw cartilages staining with Alcian Blue. The images are representative of 3 experiments (30 embryos each). |
Reprinted from Molecular and Cellular Endocrinology, 424, Marelli, F., Carra, S., Agostini, M., Cotelli, F., Peeters, R., Chatterjee, K., Persani, L., Patterns of thyroid hormone receptor expression in zebrafish and generation of a novel model of resistance to thyroid hormone action, 102-17, Copyright (2016) with permission from Elsevier. Full text @ Mol. Cell. Endocrinol.