
Image
|
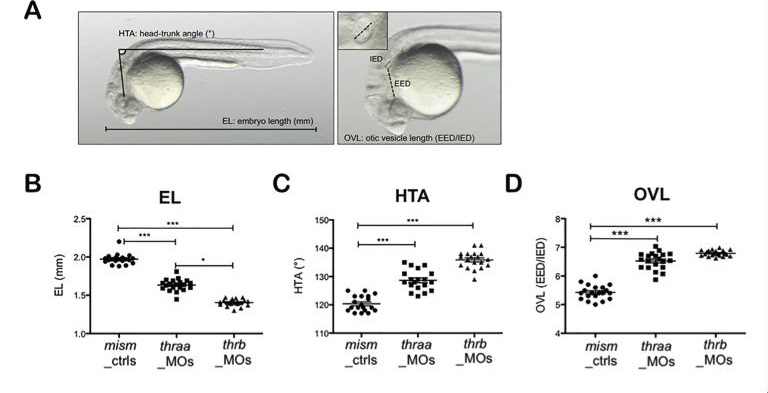
Figure Caption
Fig. S4
Analysis of embryonic development of thraa_MOs and thrb_MOs. A) Representation of the three developmental parameters in embryos at 24 hpf. EL: embryonic length; HTA: head-trunk angle; OVL: otic vesicle length. The OVL derived from the ratio between the ear and eye distance (EED) and the inner ear diameters (IED) (2). B) Analysis of embryonic development of mism_ctrls, thraa_ and thrb_MOs. Values represent the mean±SD of 20 embryos each. *p<0.05; ***p<0.001.
Figure Data
Acknowledgments
This image is the copyrighted work of the attributed author or publisher, and
ZFIN has permission only to display this image to its users.
Additional permissions should be obtained from the applicable author or publisher of the image.
Reprinted from Molecular and Cellular Endocrinology, 424, Marelli, F., Carra, S., Agostini, M., Cotelli, F., Peeters, R., Chatterjee, K., Persani, L., Patterns of thyroid hormone receptor expression in zebrafish and generation of a novel model of resistance to thyroid hormone action, 102-17, Copyright (2016) with permission from Elsevier. Full text @ Mol. Cell. Endocrinol.