
|
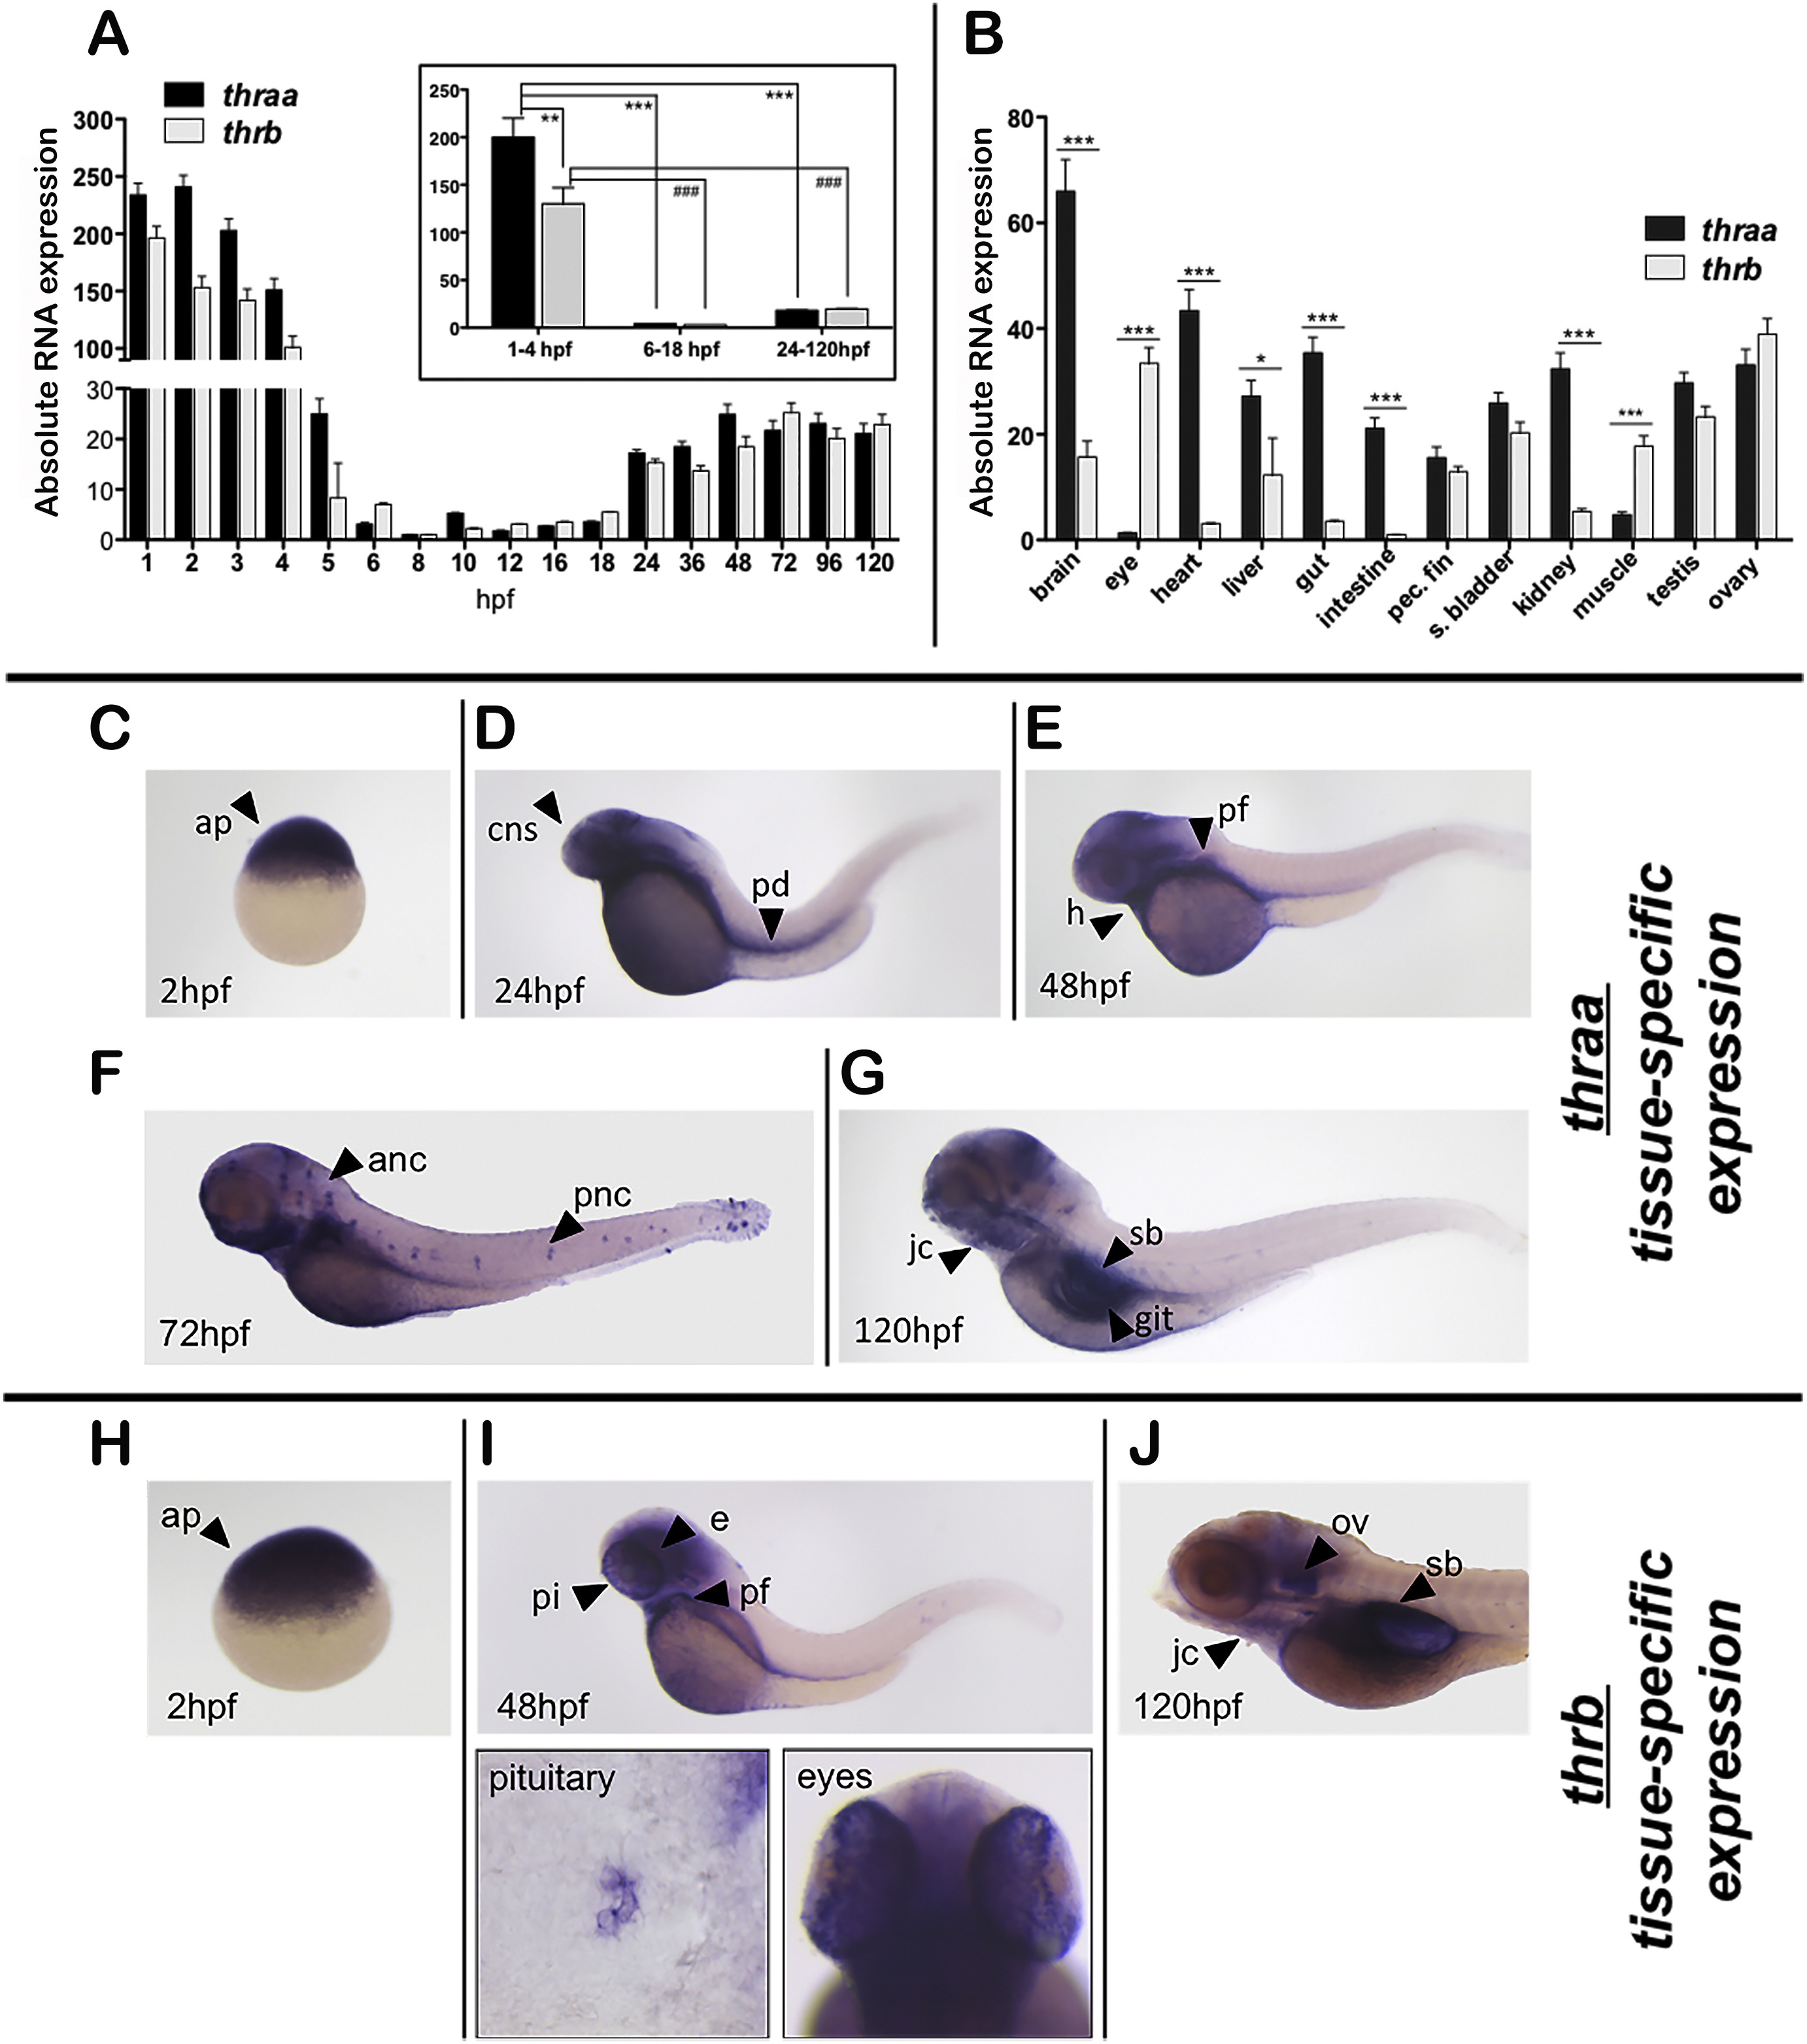
Fig. 2
Ontogenetic pattern of thraa and thrb expression in zebrafish. Panel A) qRT-PCR of thraa and thrb absolute mRNAs expression during embryonic development and larval transition (1-120hpf). The average expression of thraa and thrb during the zygote-blastula stage (1-4 hpf), gastrula-segmentation (6-18 hpf) and late embryonic and larval stages (24-120 hpf) are illustrated in the inset. **p < 0.01; ***p < 0.001; ###p < 0.001. Panel B) qRT-PCR of thraa and thrb absolute expression in adult tissues, total RNA was extracted from 5 adults. *p < 0.05; ***p < 0.001. Panels C-J) Tissue-specific expression of TRs, at different developmental stages, analyzed by WISH using thraa or thrb riboprobes followed by NBT/BCIP staining. Images are representative of 3 experiments (50 embryos each). ap: animal pole of the zygote; cns: central nervous system; pd: pronephric ducts; h: heart; pf: pectoral fins; anc: anterior neuromast cells; pnc: posterior neuromast cells; git: gastrointestinal tract; jc: jaw cartilages; sb: swim bladder; e: eyes, pi: pituitary; ov: otic vesicle.
Reprinted from Molecular and Cellular Endocrinology, 424, Marelli, F., Carra, S., Agostini, M., Cotelli, F., Peeters, R., Chatterjee, K., Persani, L., Patterns of thyroid hormone receptor expression in zebrafish and generation of a novel model of resistance to thyroid hormone action, 102-17, Copyright (2016) with permission from Elsevier. Full text @ Mol. Cell. Endocrinol.