
Fig. 7
- ID
- ZDB-FIG-160404-23
- Publication
- Marelli et al., 2016 - Patterns of thyroid hormone receptor expression in zebrafish and generation of a novel model of resistance to thyroid hormone action
- Other Figures
- All Figure Page
- Back to All Figure Page
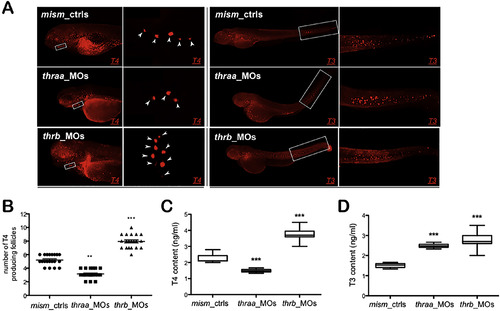
Qualitative and quantitative analysis of TH levels at 120 hpf. Panel A) Immunofluorescence with anti-T4 and anti-T3 antibodies. The T4-positive thyroid follicles are visible in lateral view (square), and in ventral view in the corresponding magnification (arrows). The T3-positive spots and their accumulation in the tail (in the magnification) are visible in lateral view. Panel B) Number of T4-positive thyroid follicles at 120 hpf. Results are expressed as mean ± SD of 20 embryos each. Panels C and D) Quantification of T4 and T3 total concentrations (ng/ml) measured with a specific ELISA kit. **p < 0.01 and ***p < 0.001 vs mism_ctrls. |
| Antibody: | |
|---|---|
| Fish: | |
| Knockdown Reagents: | |
| Anatomical Term: | |
| Stage: | Day 5 |
| Fish: | |
|---|---|
| Knockdown Reagents: | |
| Observed In: | |
| Stage: | Day 5 |
Reprinted from Molecular and Cellular Endocrinology, 424, Marelli, F., Carra, S., Agostini, M., Cotelli, F., Peeters, R., Chatterjee, K., Persani, L., Patterns of thyroid hormone receptor expression in zebrafish and generation of a novel model of resistance to thyroid hormone action, 102-17, Copyright (2016) with permission from Elsevier. Full text @ Mol. Cell. Endocrinol.