- Title
-
Formation of the spinal network in zebrafish determined by domain-specific pax genes
- Authors
- Ikenaga, T., Urban, J.M., Gebhart, N., Hatta, K., Kawakami, K., and Ono, F.
- Source
- Full text @ J. Comp. Neurol.
|
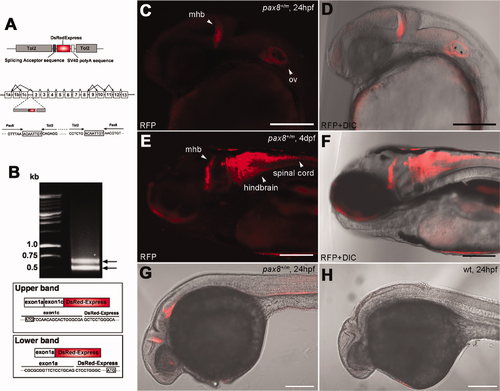
Insertion of RFP in the pax8 gene leads to RFP expression. A: Schematic diagram of the DNA construct used in the gene trap screening (top). The construct has a splicing acceptor site, DsRedExpress sequence, and the SV40 poly-A sequence. Tol2 sequences are at both ends. Exon composition of the pax8 gene in zebrafish is shown with possible alternative splicing combinations (middle). The insertion of the Tol2 sequence was detected in the first intron between exon 1c and exon 2. The nucleic acid sequence surrounding junctions is shown (bottom). Note the repeat of eight nucleic acids at both ends of the insertion, a phenomenon commonly observed with the Tol2 insertion. B: An electrophoresis image of RACE PCR products. Two distinct bands were detected. The upper band corresponded to the splicing of exons 1a and 1c and DsRed, whereas the lower band corresponded to the splicing between exon 1a and DsRed. Presumptive translation initiation site for each transcript is shown with a box. C,D: Confocal image of RFP signal in pax8+/m embryos at 24 hpf (C). The signal is detected at the midbrain–hindbrain boundary (mhb) and the otic vesicle (ov). D shows the merged image with transmitted light. E,F: At 4 dpf, the signal is detected also in the hindbrain and the spinal cord. F is the merged image with transmitted light. G,H: RFP antibody stains the mhb, otic vesicle and the kidney at 24 hpf (G). H is a wild-type embryo control. Scale bars = 200 μm. |
|
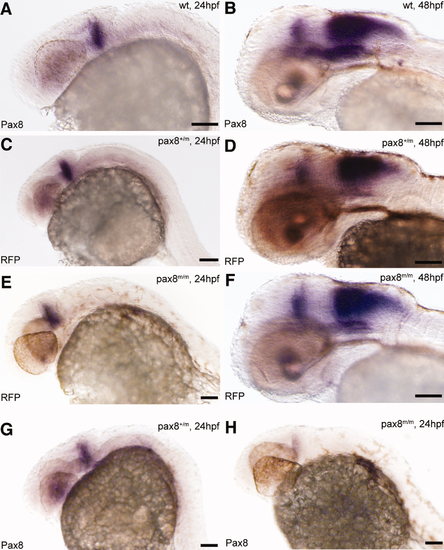
Pax8 expression is identical to RFP expression. Transcripts were detected using in situ hybidization with either pax8 (A,B,G,H) or RFP (C–F) probes in 24-hpf (A,C,E,G,H) or 48-hpf (B,D,F) embryos. Expression pattern, at 24 hpf, of pax8 in wild type (pax8+/+; A) was the same as that of RFP in pax8+/m (C) and pax8m/m (E). Signal was detected in the mhb region of the embryos. RFP showed no signal in wild-type samples (data not shown). At 48 hpf, the staining pattern of pax8 in wild type (B) resembled that of RFP expression in pax8+/m (D) and pax8m/m (F) embryos. Pax8+/m embryos showed positive staining also with the pax8 probe (G). Pax8 transcripts were also detected, at a much lower intensity, in pax8m/m embryos (H). Scale bars = 100 μm. |
|
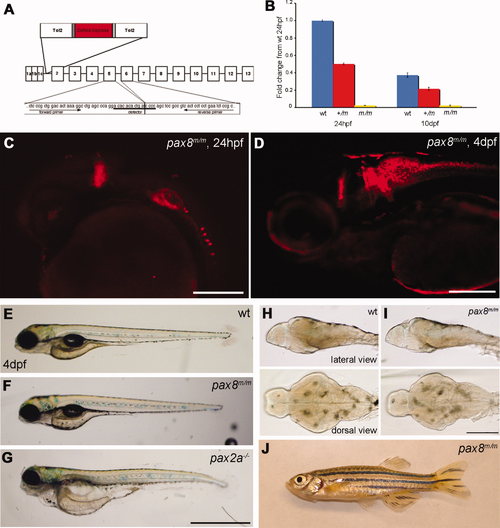
Homozygous embryos are Pax8 hypomorphs. A: The exon composition of zebrafish pax8 indicating the insertion site of Tol2. Primers for the qPCR were designed so that the amplicon spans the junction between exon 5 and exon 6. B: qPCR of the pax8 transcript in wild-type (wt), pax8+/m, and pax8m/m fish at 1 dpf and 10 dpf. Wild type at 1 dpf was used as a reference sample to obtain relative transcript amounts. Error bars represent the SEM of the average from triplicates of a single run (n = 3). C,D: Confocal images of RFP signals in pax8m/m fish at 24 hpf (C) and 4 dpf (D). E–G: The gross morphology of larva at 4 dpf. E is wild type, F is pax8m/m, and G is pax2a–/–. The pax2a–/– larva is deformed and dies at 7–10 dpf. H,I: The brain morphology is normal in the pax8m/m larva (I) compared with the WT larva (H). Top is the lateral view and bottom is the dorsal view. J: Adult pax8m/m fish. Scale bars = 200 μm in C,D; 1 mm in G (applies to E–G; 500 μm in I (applies to H,I). |
|
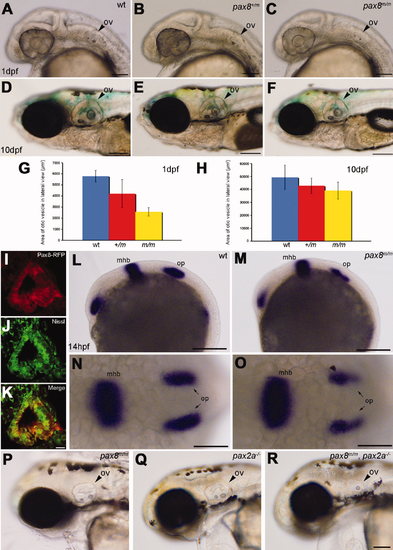
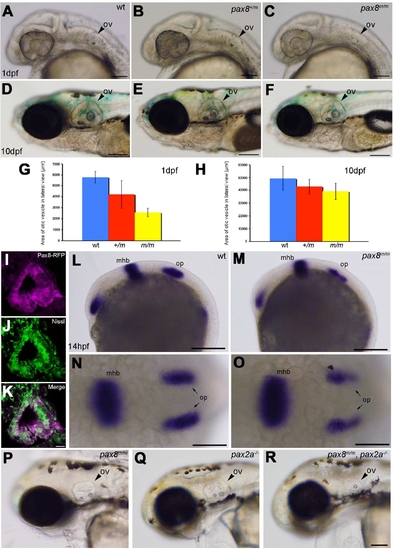
Otic vesicle formation defects in pax2a/pax8 mutants. A–F: The otic vesicle (ov) size is slightly reduced in pax8m/m fish. Lateral view of the head region at 1 dpf (A–C) and 10 dpf (D–F). A and D are the wild type (wt), B and E are pax8+/m, and C and F are pax8m/m. G,H: The area of the otic vesicle as measured in the lateral view at 1 dpf (G) and 10 dpf (H). Wild-type (blue), pax8+/m (red), and pax8m/m fish (yellow). The average and the standard deviation are shown (n = 6 each). I–K: RFP+ cells (I) line the cavity of the otic vesicle, as visualized by the Nissle counterstain (J) at 1dpf. The merged picture is shown in K. L–O: In situ hybridization with pax2a probes in wild-type (L,N) and pax8m/m embryos (M,O) at 14 hpf. Pax2a expression is detected in retina, mhb, and otic placode (op) in wild type. Note the signal in the otic placode is weaker in pax8m/m embryo. The difference is more obvious in the higher magnification of the dorsal view (N,O). P,Q,R: The reduction of the otic vesicle size is more pronounced in the pax2a/pax8 double mutant. The lateral view of the head is shown for pax8m/m (P), pax2a–/– (Q), and pax2a/pax8 double-mutant embryos at 2 dpf (R). Magenta-green images for I–K are provided in Supporting Information Figure 2. Scale bars = 100 μm for A–C; 200 μm in F (applies to D–F); 10 μm in K (applies to I–K); 200 μm in L,M; 100 μm in N,O; 100 μm in R (applies to P–R). |
|
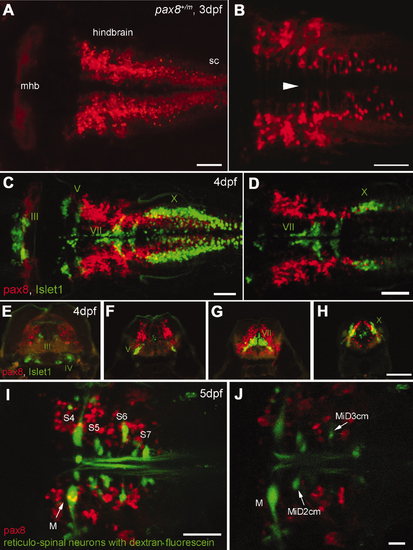
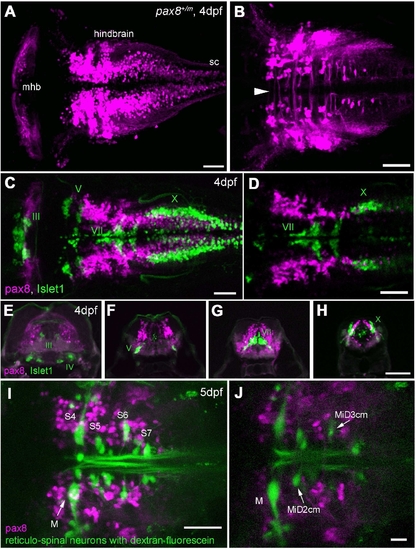
RFP expression in the central nervous system. A,B: Confocal images displaying RFP+ cells in the hindbrain. A is a dorsal view of the hindbrain, and B is a higher magnification of the ventral region. Note the rostral end of the hindbrain lacks RFP+ cells (A). In the ventral region (B), axon-like structures were detected crossing the midline (arrowhead). sc, Spinal cord. C,D: RFP+ cells (red) in the hindbrain compared with the islet-1 GFP-expressing motor neurons (green). C is a stack of confocal images. D displays a single confocal plane near the Xth (X) motor nuclei. Note that two populations (red and green) do not overlap. E–H: A longitudinal series of the hindbrain sections is shown from the level of IIIrd, IVth (E), Vth (F), VIIth (G), and Xth (H) motor nucleus. RFP+ cells are red, and islet-1 expressing motor neurons are green. I,J: RFP+ cells (red) in the hindbrain were compared with the reticular neurons stained by the tracing dye, dextran fluorescein (green). I is a stack of confocal images and J is a single plane at the level of the Mauthner cell (M). S4 through S7 indicates segment number. Magenta-green images are provided in Supporting Information Figure 3. Scale bars = 50 μm in A–D,I; 100 μm in H (applies to E–H); 20 μm in J. |
|
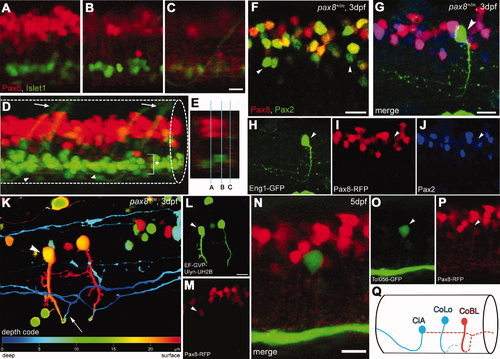
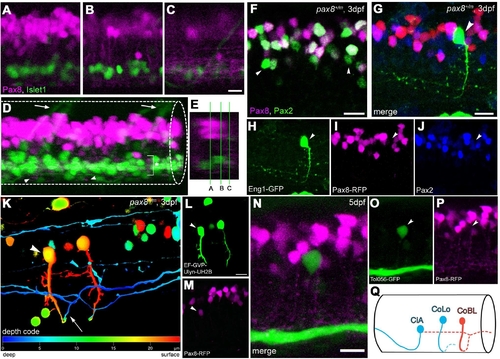
Interneurons in the spinal cord expressing pax2a or pax8. A–E: RFP+ neurons are detected in the dorsal portion of the spinal cord; RFP (red), islet-1:GFP (green). Single-place confocal images (A–C) show the position of RFP+ cells and islet-1 expressing secondary motor neurons. D is the 3D reconstruction. Arrowheads indicate commissural axons labeled by RFP and arrows indicate motor neuron axons labeled by GFP. The area with an asterisk has a plexus-like structure of RFP+ fibers. An optical cross section (E) displays the level of confocal planes corresponding to A–C. F:Pax8+/m fish stained with anti-Pax2; RFP (red), anti-Pax2 (green). Arrowheads are Pax2+ cells without RFP. G–J: CiA neurons express Pax2 but lack RFP expression. G is a stack of confocal images with eng1-GFP (green), RFP (red) and Pax2 (blue). H–J are single-plane images to show that the GFP+ cell is Pax2+ but RFP–. K–M: CoBL neurons express RFP. K is a stack of confocal images in depth coding. The cell with an arrow has the characteristic axon pattern of CoBL. In single planes, the GFP+ cell is also RFP+ (L,M). N–P: CoLo neurons labeled with GFP (green) in Tol-056 fish do not express RFP (red). N is a merged image. O and P show that the marked cell expresses GFP but not RFP. Q: Schema of CiA, CoLo, and CoBL interneurons in the spinal cord. The position of the cell body and the axon projection are shown. Rostral is to the left. Note that CiA and CoLo (blue) do not express RFP, but CoBL (red) express RFP. Magenta-green images are provided in Supporting Information Figure 4. Scale bars = 10 μm in C (applies to A–C); 10 μm in F,G,N; 10 μm in L (applies to L,M). |
|
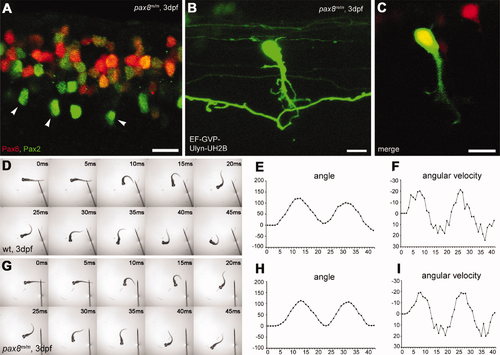
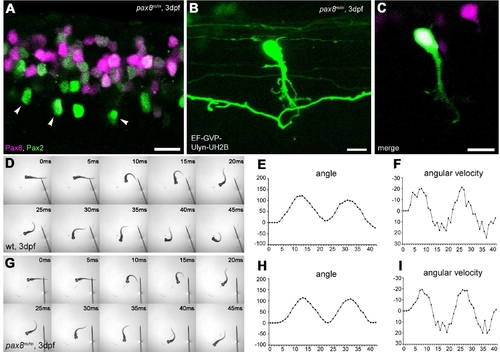
Spinal neurons in pax8 mutant. A: Spinal cord of a pax8m/m fish stained with anti-Pax2; RFP (red), anti-Pax2 (green). B,C: CoBL cell in pax8m/m fish. B is a stack of confocal images, and C is a single confocal plane; GFP (green), RFP (red). D–I: Touch response of wild-type (top, D–F) and pax8m/m fish (bottom, G–I) at 3 dpf. High-speed images of escape response are shown from 0 to 45 msec (D,G). In E,F,H,I, the head angle (E,H) and the angular velocity (F,I) were plotted against time. Magenta-green images of A–C are provided in Supporting Information Figure 5. Scale bars = 10 μm. |
|
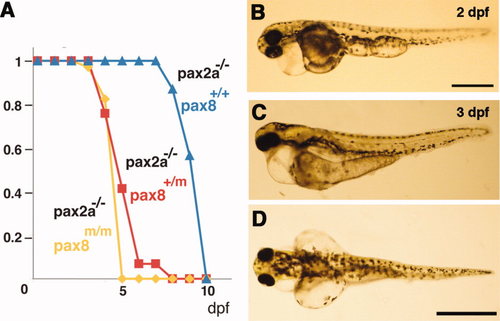
Pax2a/pax8 double mutant. A: Survival curve of pax2a mutants with different pax8 genotypes. Blue, red, and yellow represent pax8+/+, pax8+/m, pax8m/m fish, respectively. B: Lateral view of a double mutant embryo at 2 dpf. C,D: Lateral (C) and dorsal (D) view of a 3-dpf double-mutant larvae. Scale bars = 500 μm in B; 1 mm in D (applies to C,D). |
|
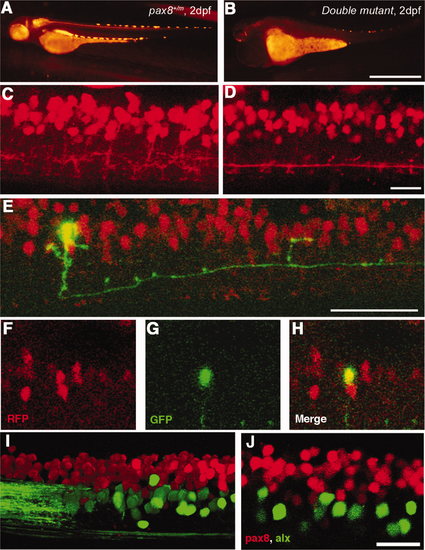
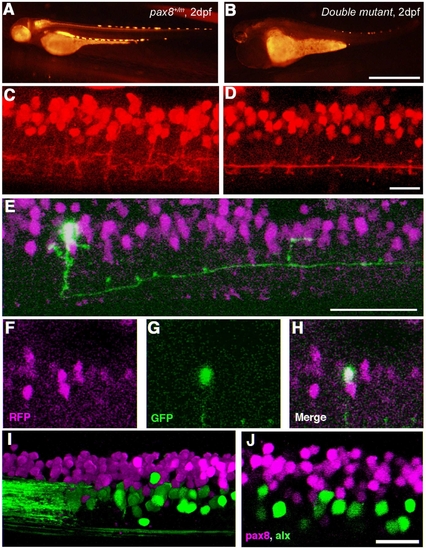
Spinal neurons in pax2a/pax8 double mutant. A,B: RFP fluorescence of a pax8+/m embryo (A) and a double-mutant embryo (B) under the same optical condition. The RFP signal is reduced in the double mutant. C,D: The RFP signal in the spinal cord of a pax8+/m embryo (C) and a double mutant embryo (D) near the fifteenth body segment. 3D images were constructed from confocal slices. E–H: Stochastic labeling by GFP (green) identified a neuron with an ipsilateral descending axon in the double mutant. E is a 3D reconstruction. F (RFP), G (GFP), and H (merged) are single-plane images. I,J: The spinal cord of a pax8+/m larva obtained from crossing with the Alx-GFP transgenic line. The image is from an embryo at 4 dpf. I is a 3D reconstruction and J is a single confocal plane. Note that RFP and GFP do not overlap. Magenta-green images are provided in Supporting Information Figure 6. Scale bars = 1 mm in B (applies to A,B); 20 μm in D (applies to C,D); 50 μm in E; 20 μm in J (applies to I,J). |
|
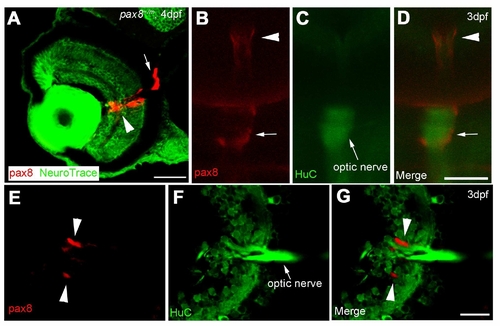
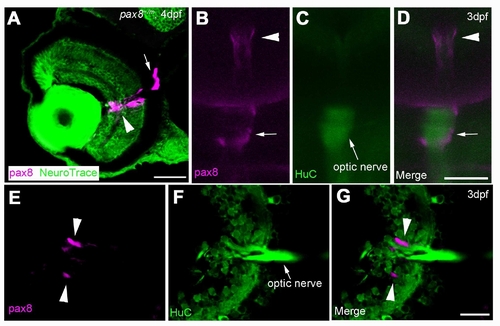
The expression of RFP in glial cells surrounding the optic nerve. A: The RFP signal detected in the eye of a 4 dpf embryo counterstained with NeuroTrace. RFP signal is located around the optic nerve. Scale: 40 μm. B, C, D: In vivo imaging of RFP (B) in a HuC-Cameleon background . Optic nerve emits fluorescence due to the presence of Cameleon (C). D is a merge. Scale: 50 μm. E, F, G: Slice of an eye from HuC-Cameleon fish expressing RFP. RFP (+) cells (E) do not show the expression of Cameleon (F). G is a merge. Scale: 20 7mu;m. Magenta/Green images are provided in Suppl. figure. 7. |
|
(Magenta-green version of Figure 4 for the assistance of color blind readers) Otic vesicle formation defects in pax2a/pax8 mutants. A-F: The otic vesicle (ov) size is slightly reduced in pax8m/m fish. Lateral view of the head region at 1 dpf (A, B, C) and 10 dpf (D, E, F). A and D are the wild type (wt), B and E are pax8+/m, and C and F are pax8m/m. Scale: 100 μm (A, B, C), 200 μm (D, E, F). G, H: The area of the otic vesicle as measured in the lateral view at 1 dpf (G) and 10 dpf (H). Wild type (Blue), pax8+/m (Red), and pax8m/m fish (Yellow). The average and the standard deviation are shown (n=6 each). I, J, K: C. RFP (+) cells (I) line the cavity of the otic vesicle, as visualized by the Nissle counterstain (J) at 1dpf. The merged picture is shown in K. Scale 10 μm. L-O: In situ hybridization with pax2a probes in wild type (L, N) and pax8m/m embryos (M, O) at 14 hpf. Pax2a expression is detected in retina, mhb and the otic placode (op) in wild type. Note the signal in the otic placode is weaker in pax8m/m embryo. The difference is more obvious in the higher magnification of the dorsal view (N and O). Scale: 200 μm (L, M), 100 μm (N, O). P, Q, R: The reduction of the otic vesicle size is more pronounced in the pax2a/pax8 double mutant. The lateral view of the head is shown for pax8m/m (P), pax2a-/- (Q) and pax2a/pax8 double mutant embryos at 2 dpf(R). Scale: 100 μm. |
|
(Magenta/Green version of Figure. 5 for the assistance of color blind readers.) RFP expression in the central nervous system. A, B: Confocal images displaying RFP (+) cells in the hindbrain. A is a dorsal view of the hindbrain and B is a higher magnification of the ventral region. Note the rostral end of the hindbrain lacks RFP (+) cells (A). In the ventral region (B), axon-like structures were detected crossing the midline (arrowhead). sc, spinal cord. Scale: 50 μm. C, D: RFP (+) cells (red) in the hindbrain compared to the islet-1 GFP expressing motor neurons (green). C is a stack of confocal images. D displays a single confocal plane near the Xth (X) motor nuclei. Note that two populations (red and green) do not overlap. Scale: 50 μm. E-H: A longitudinal series of the hindbrain sections are shown from the level of IIIrd, IVth (E), Vth (F), VIIth (G), and Xth motor nucleus (H). RFP (+) cells are red and islet-1 expressing motor neurons are green. Scale: 100 μm. I, J: RFP (+) cells (red) in the hindbrain were compared to the reticular neurons stained by the tracing dye, dextran fluorescein (green). I is a stack of confocal images and J is a single plane at the level of the Mauthner cell (M). S4 through S7 indicates segment number. Scale: 50 μm (I), 20 μm (J). |
|
(Magenta/Green version of Figure. 6 for the assistance of color blind readers.) Interneurons in the spinal cord expressing pax2a or pax8. A-E: RFP (+) neurons are detected in the dorsal portion of the spinal cord; RFP (red), islet-1:GFP (green). Single place confocal images (A, B, C) show the position of RFP(+) cells and islet-1 expressing secondary motor neurons. Scale: 10 µm. D is the 3D reconstruction. Arrowheads indicate commissural axons labeled by RFP and arrows indicate motor neuron axons labeled by GFP. The area with an asterisk has a plexus-like structure of RFP (+) fibers. An optical cross section (E) displays the level of confocal planes corresponding to A, B and C. F: Pax8+/m fish stained with anti-Pax2; RFP (red), anti- Pax2 (green). Arrowheads are Pax2 (+) cells without RFP. Scale: 10 μm. G-J: CiA neurons express Pax2 but lack RFP expression. G is a stack of confocal images with eng1-GFP (green), RFP (red) and Pax2 (blue). H-J are single plane images to show that the GFP (+) cell is Pax2 (+) but RFP (-). Scale: 10 μm. K, L, M:.CoBL neurons express RFP. K is a stack of confocal images in depth coding. The cell with an arrow has the characteristic axon pattern of CoBL. In single planes, the GFP (+) cell is also RFP (+) (L and M). Scale: 10 μm. N, O, P: CoLo neurons labeled with GFP (green) in Tol-056 fish do not express RFP (red). N is a merged image. O and P show that the marked cell expresses GFP but not RFP. Scale: 10 μm. Q: Schema of CiA, CoLo and CoBL interneurons in the spinal cord. The position of the cell body and the axon projection are shown. Rostral to the left. Note that CiA and CoLo (blue) do not express RFP, while CoBL (red) express RFP. |
|
(Magenta/Green version of Figure. 7 for the assistance of color blind readers.) Spinal neurons in pax8 mutant. A: Spinal cord of a pax8m/m fish stained with anti-Pax2; RFP (red), anti-Pax2 (green). Scale: 10 μm. B, C: CoBL cell in pax8m/m fish. B is a stack of confocal images and C is a single confocal plane; GFP (green), RFP (red). Scale: 10 μm. D-I: Touch response of wild type (top, D, E, F) and pax8m/m fish (bottom, G, H, I) at 3 dpf. High-speed images of escape response are shown from 0 ms to 45 ms (D, G). In E, F, H, I, the head angle (E, H) and the angular velocity (F, I) were plotted against time. |
|
(Magenta/Green version of Figure 9 for the assistance of color blind readers.) Spinal neurons in pax2a/pax8 double mutant. A, B: RFP fluorescence of a pax8+/m embryo (A) and a double mutant embryo (B) under the same optical condition. The RFP signal is reduced in the double mutant. Scale: 1 mm. C, D: The RFP signal in the spinal cord of a pax8+/m embryo (C) and a double mutant embryo (D) near the 15th body segment. 3D images were constructed from confocal slices. Scale: 20 μm. E-H: Stochastic labeling by GFP (green) identified a neuron with an ipsilateral descending axon in the double mutant. E is a 3D reconstruction. F (RFP), G (GFP), and H (merged) are single plane images. Scale: 50 μm. I, J: The spinal cord of a pax8+/m larva obtained from crossing with the Alx-GFP transgenic line. The image is from an embryo at 4 dpf. I is a 3D reconstruction and J is a single confocal plane. Note that RFP and GFP do not overlap. Scale: 20 μm. |
|
(Magenta/Green version of Supplementary Figure. 1 for the assistance of color blind readers.) |

