
Image
|
Figure Caption
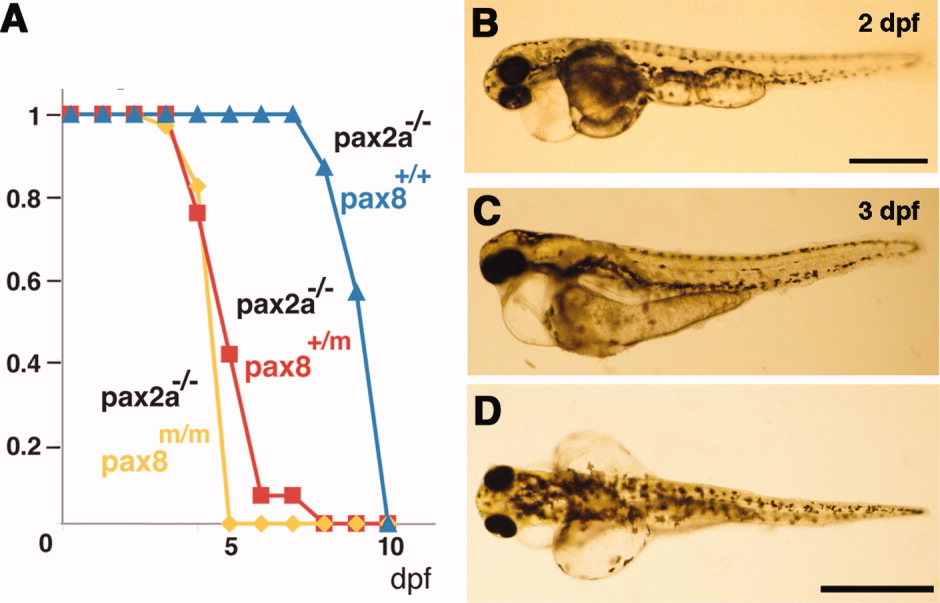
Fig. 8
Pax2a/pax8 double mutant. A: Survival curve of pax2a mutants with different pax8 genotypes. Blue, red, and yellow represent pax8+/+, pax8+/m, pax8m/m fish, respectively. B: Lateral view of a double mutant embryo at 2 dpf. C,D: Lateral (C) and dorsal (D) view of a 3-dpf double-mutant larvae. Scale bars = 500 μm in B; 1 mm in D (applies to C,D).
Acknowledgments
This image is the copyrighted work of the attributed author or publisher, and
ZFIN has permission only to display this image to its users.
Additional permissions should be obtained from the applicable author or publisher of the image.
Full text @ J. Comp. Neurol.