
|
Fig. 5
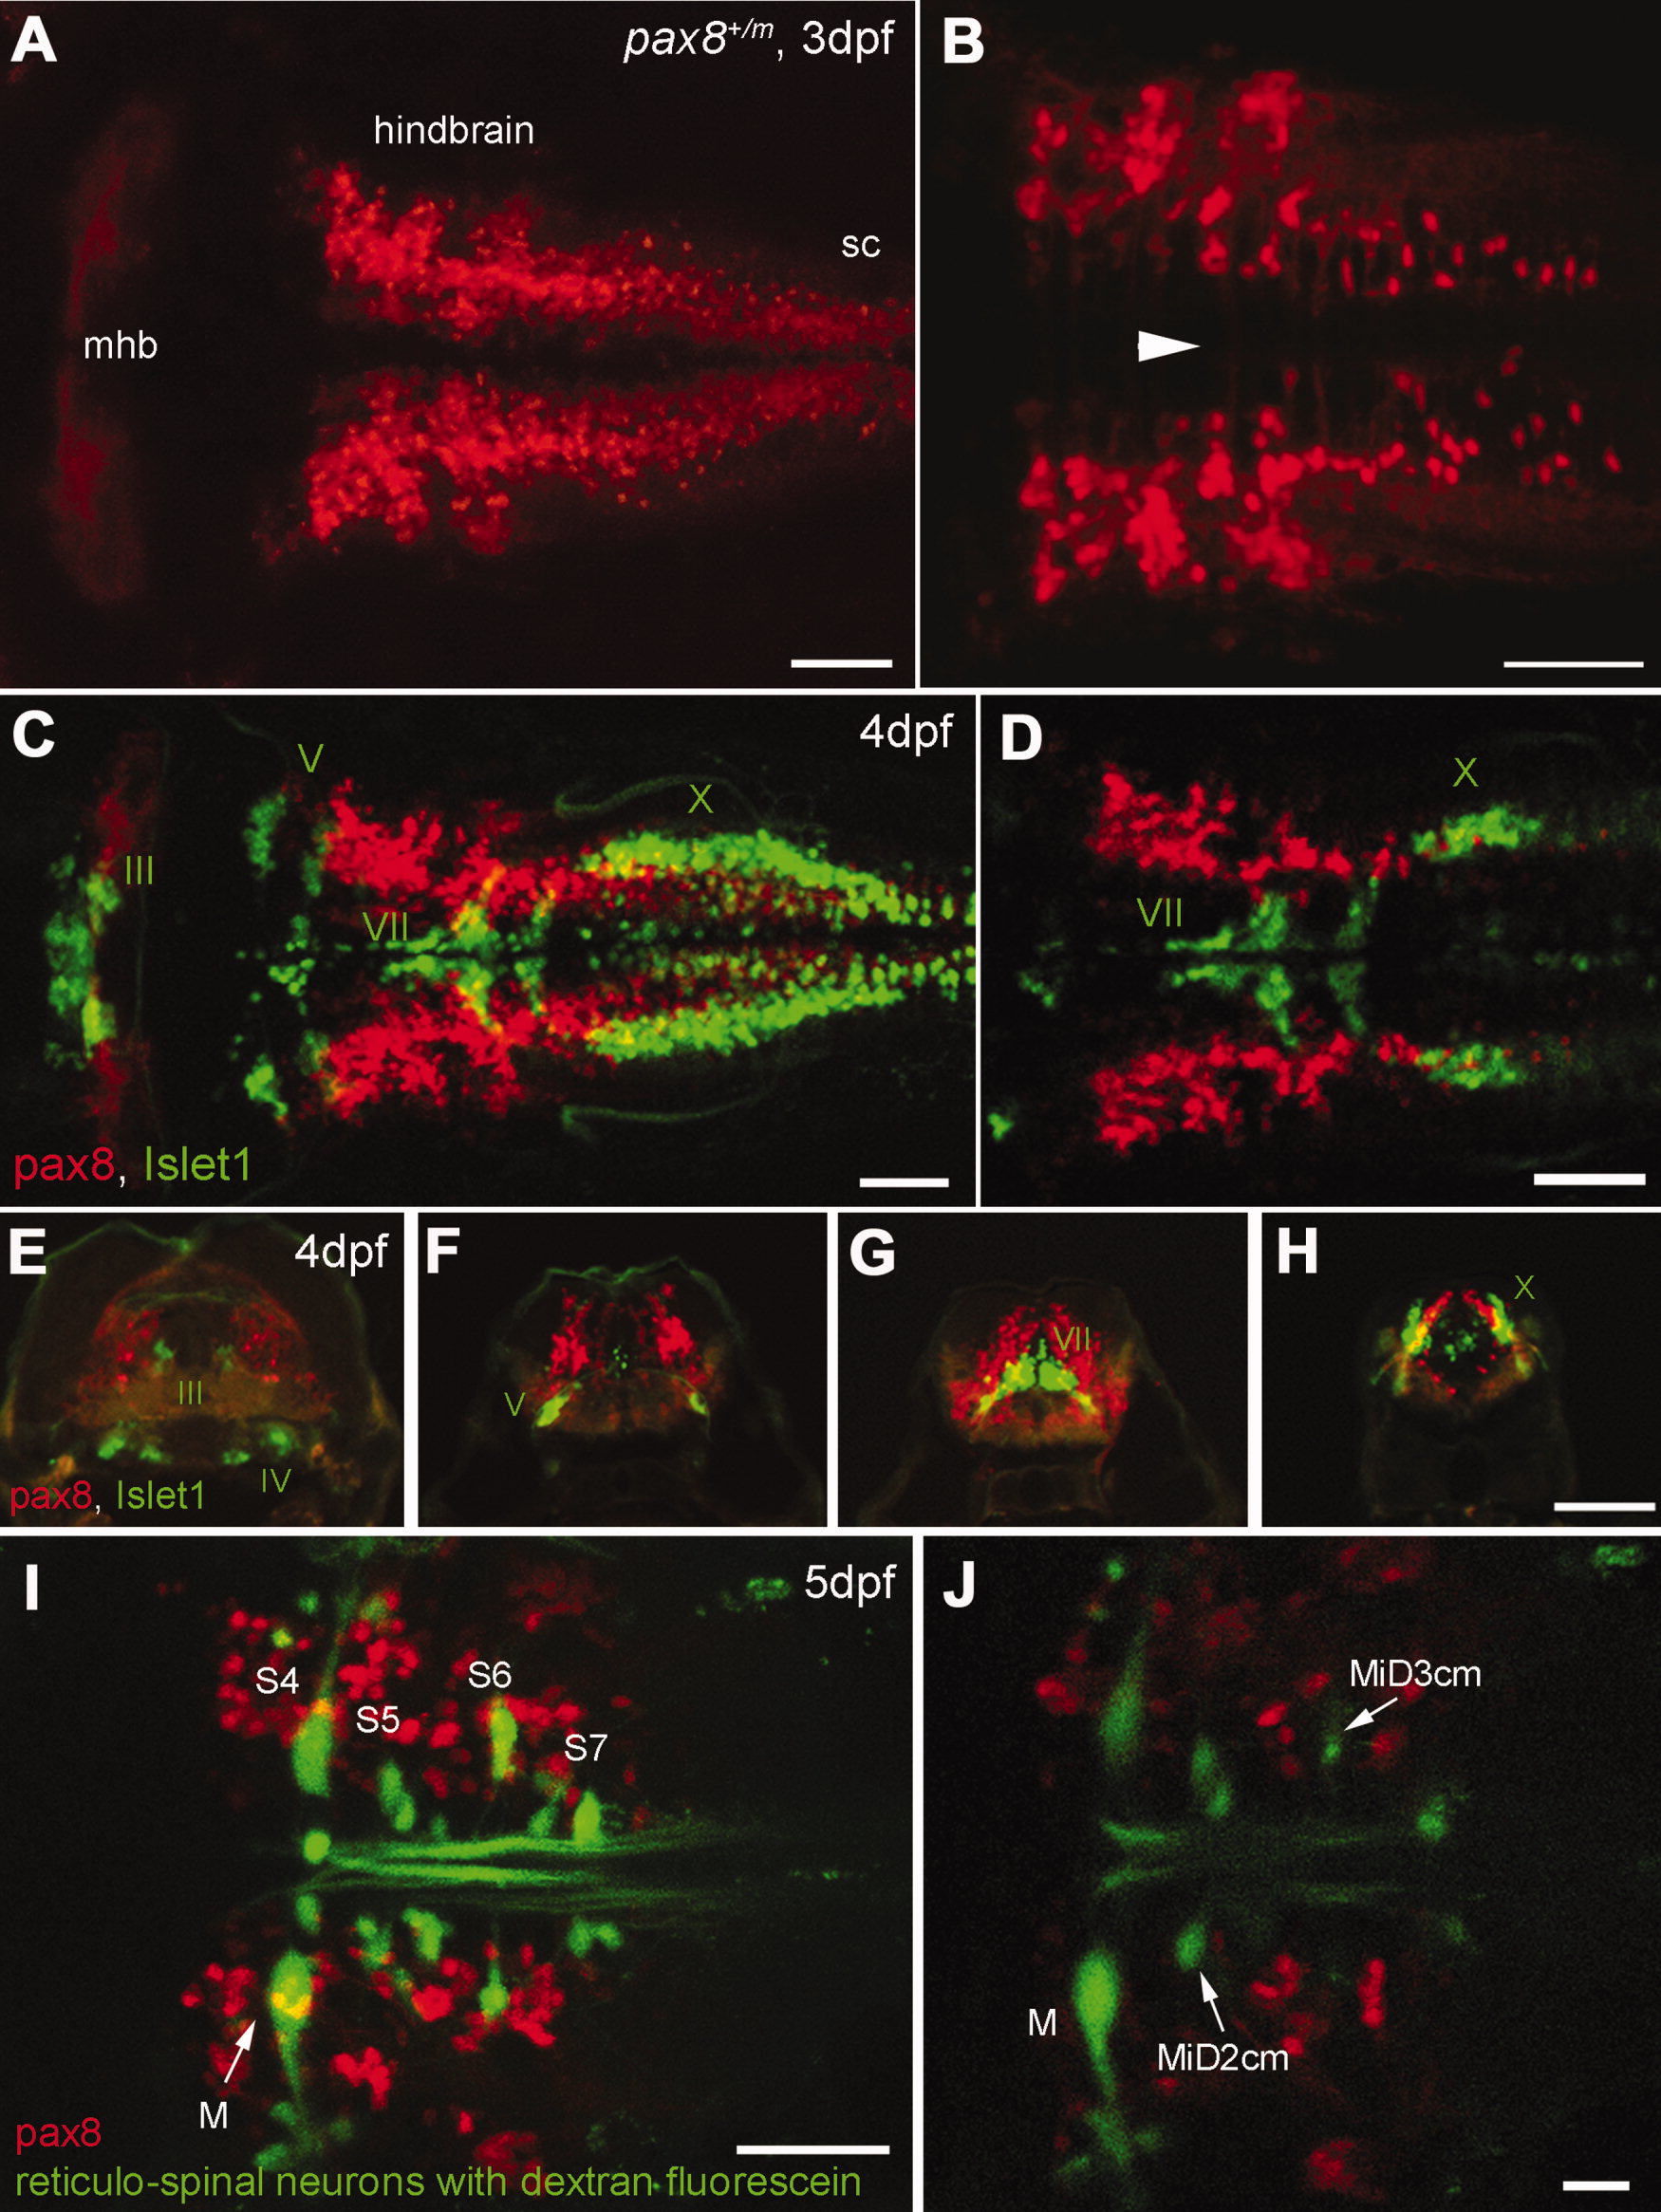
RFP expression in the central nervous system. A,B: Confocal images displaying RFP+ cells in the hindbrain. A is a dorsal view of the hindbrain, and B is a higher magnification of the ventral region. Note the rostral end of the hindbrain lacks RFP+ cells (A). In the ventral region (B), axon-like structures were detected crossing the midline (arrowhead). sc, Spinal cord. C,D: RFP+ cells (red) in the hindbrain compared with the islet-1 GFP-expressing motor neurons (green). C is a stack of confocal images. D displays a single confocal plane near the Xth (X) motor nuclei. Note that two populations (red and green) do not overlap. E–H: A longitudinal series of the hindbrain sections is shown from the level of IIIrd, IVth (E), Vth (F), VIIth (G), and Xth (H) motor nucleus. RFP+ cells are red, and islet-1 expressing motor neurons are green. I,J: RFP+ cells (red) in the hindbrain were compared with the reticular neurons stained by the tracing dye, dextran fluorescein (green). I is a stack of confocal images and J is a single plane at the level of the Mauthner cell (M). S4 through S7 indicates segment number. Magenta-green images are provided in Supporting Information Figure 3. Scale bars = 50 μm in A–D,I; 100 μm in H (applies to E–H); 20 μm in J.