
|
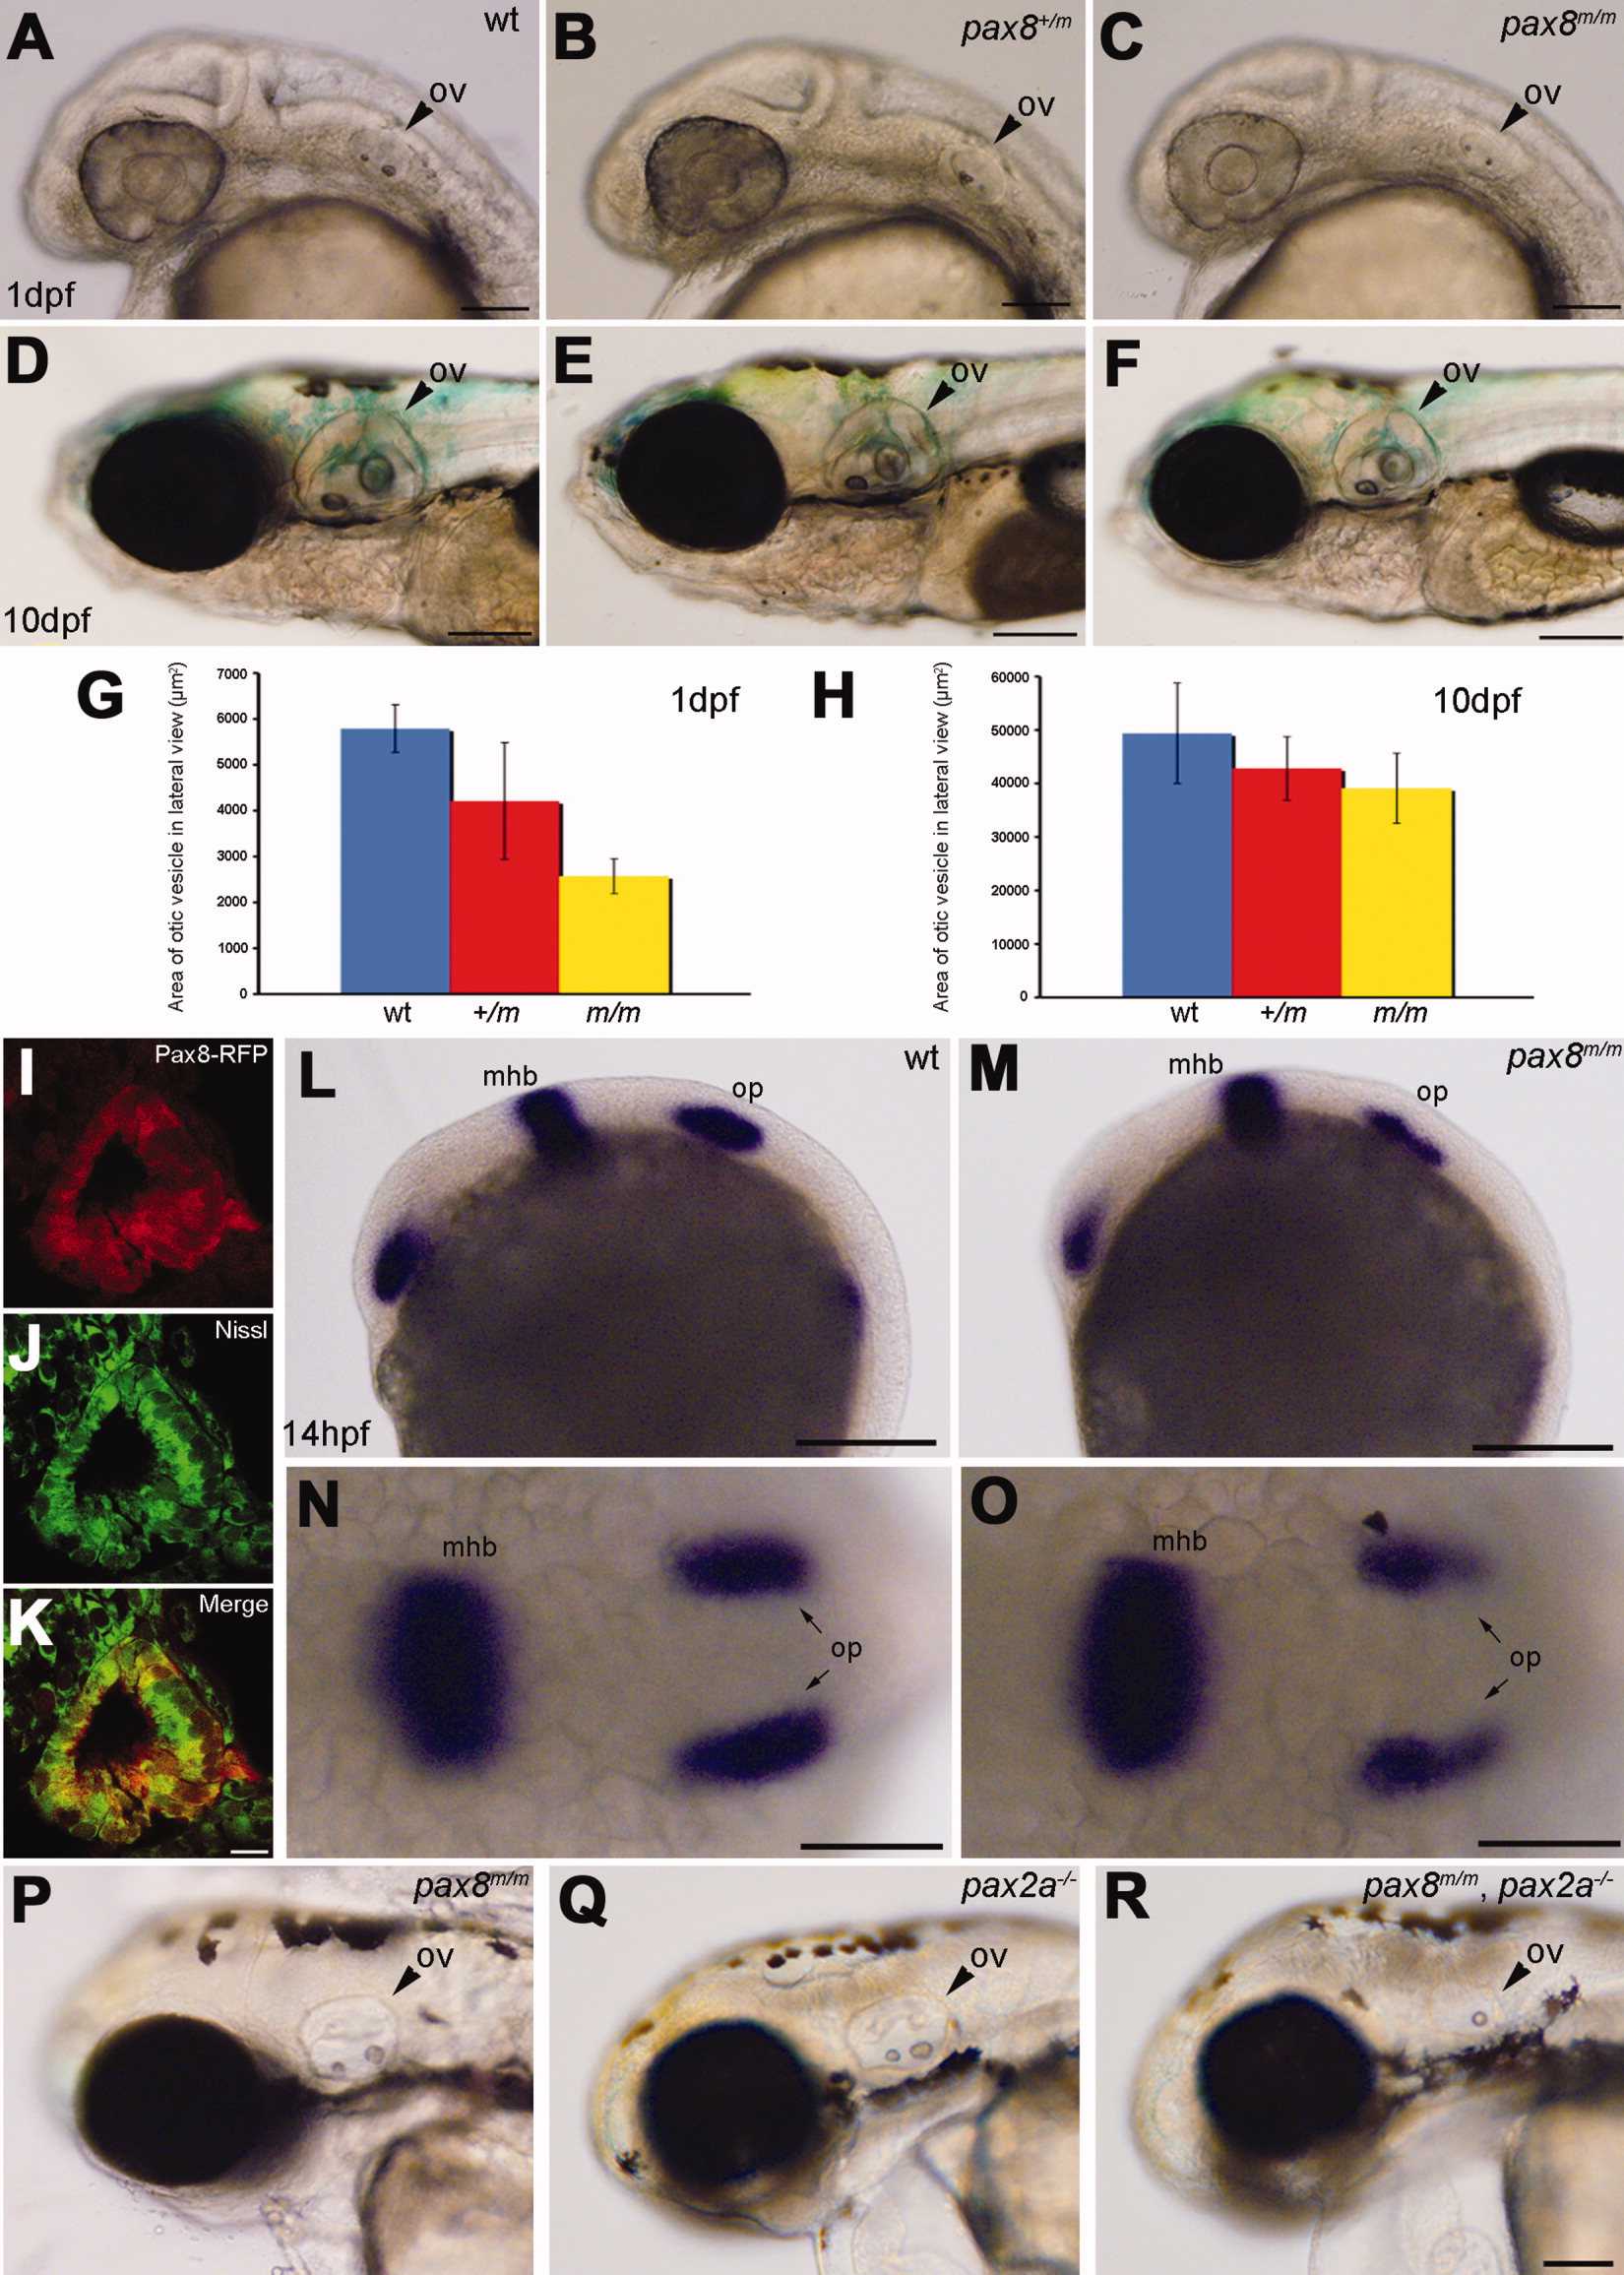
Fig. 4
Otic vesicle formation defects in pax2a/pax8 mutants. A–F: The otic vesicle (ov) size is slightly reduced in pax8m/m fish. Lateral view of the head region at 1 dpf (A–C) and 10 dpf (D–F). A and D are the wild type (wt), B and E are pax8+/m, and C and F are pax8m/m. G,H: The area of the otic vesicle as measured in the lateral view at 1 dpf (G) and 10 dpf (H). Wild-type (blue), pax8+/m (red), and pax8m/m fish (yellow). The average and the standard deviation are shown (n = 6 each). I–K: RFP+ cells (I) line the cavity of the otic vesicle, as visualized by the Nissle counterstain (J) at 1dpf. The merged picture is shown in K. L–O: In situ hybridization with pax2a probes in wild-type (L,N) and pax8m/m embryos (M,O) at 14 hpf. Pax2a expression is detected in retina, mhb, and otic placode (op) in wild type. Note the signal in the otic placode is weaker in pax8m/m embryo. The difference is more obvious in the higher magnification of the dorsal view (N,O). P,Q,R: The reduction of the otic vesicle size is more pronounced in the pax2a/pax8 double mutant. The lateral view of the head is shown for pax8m/m (P), pax2a–/– (Q), and pax2a/pax8 double-mutant embryos at 2 dpf (R). Magenta-green images for I–K are provided in Supporting Information Figure 2. Scale bars = 100 μm for A–C; 200 μm in F (applies to D–F); 10 μm in K (applies to I–K); 200 μm in L,M; 100 μm in N,O; 100 μm in R (applies to P–R).