
|
Fig. s2
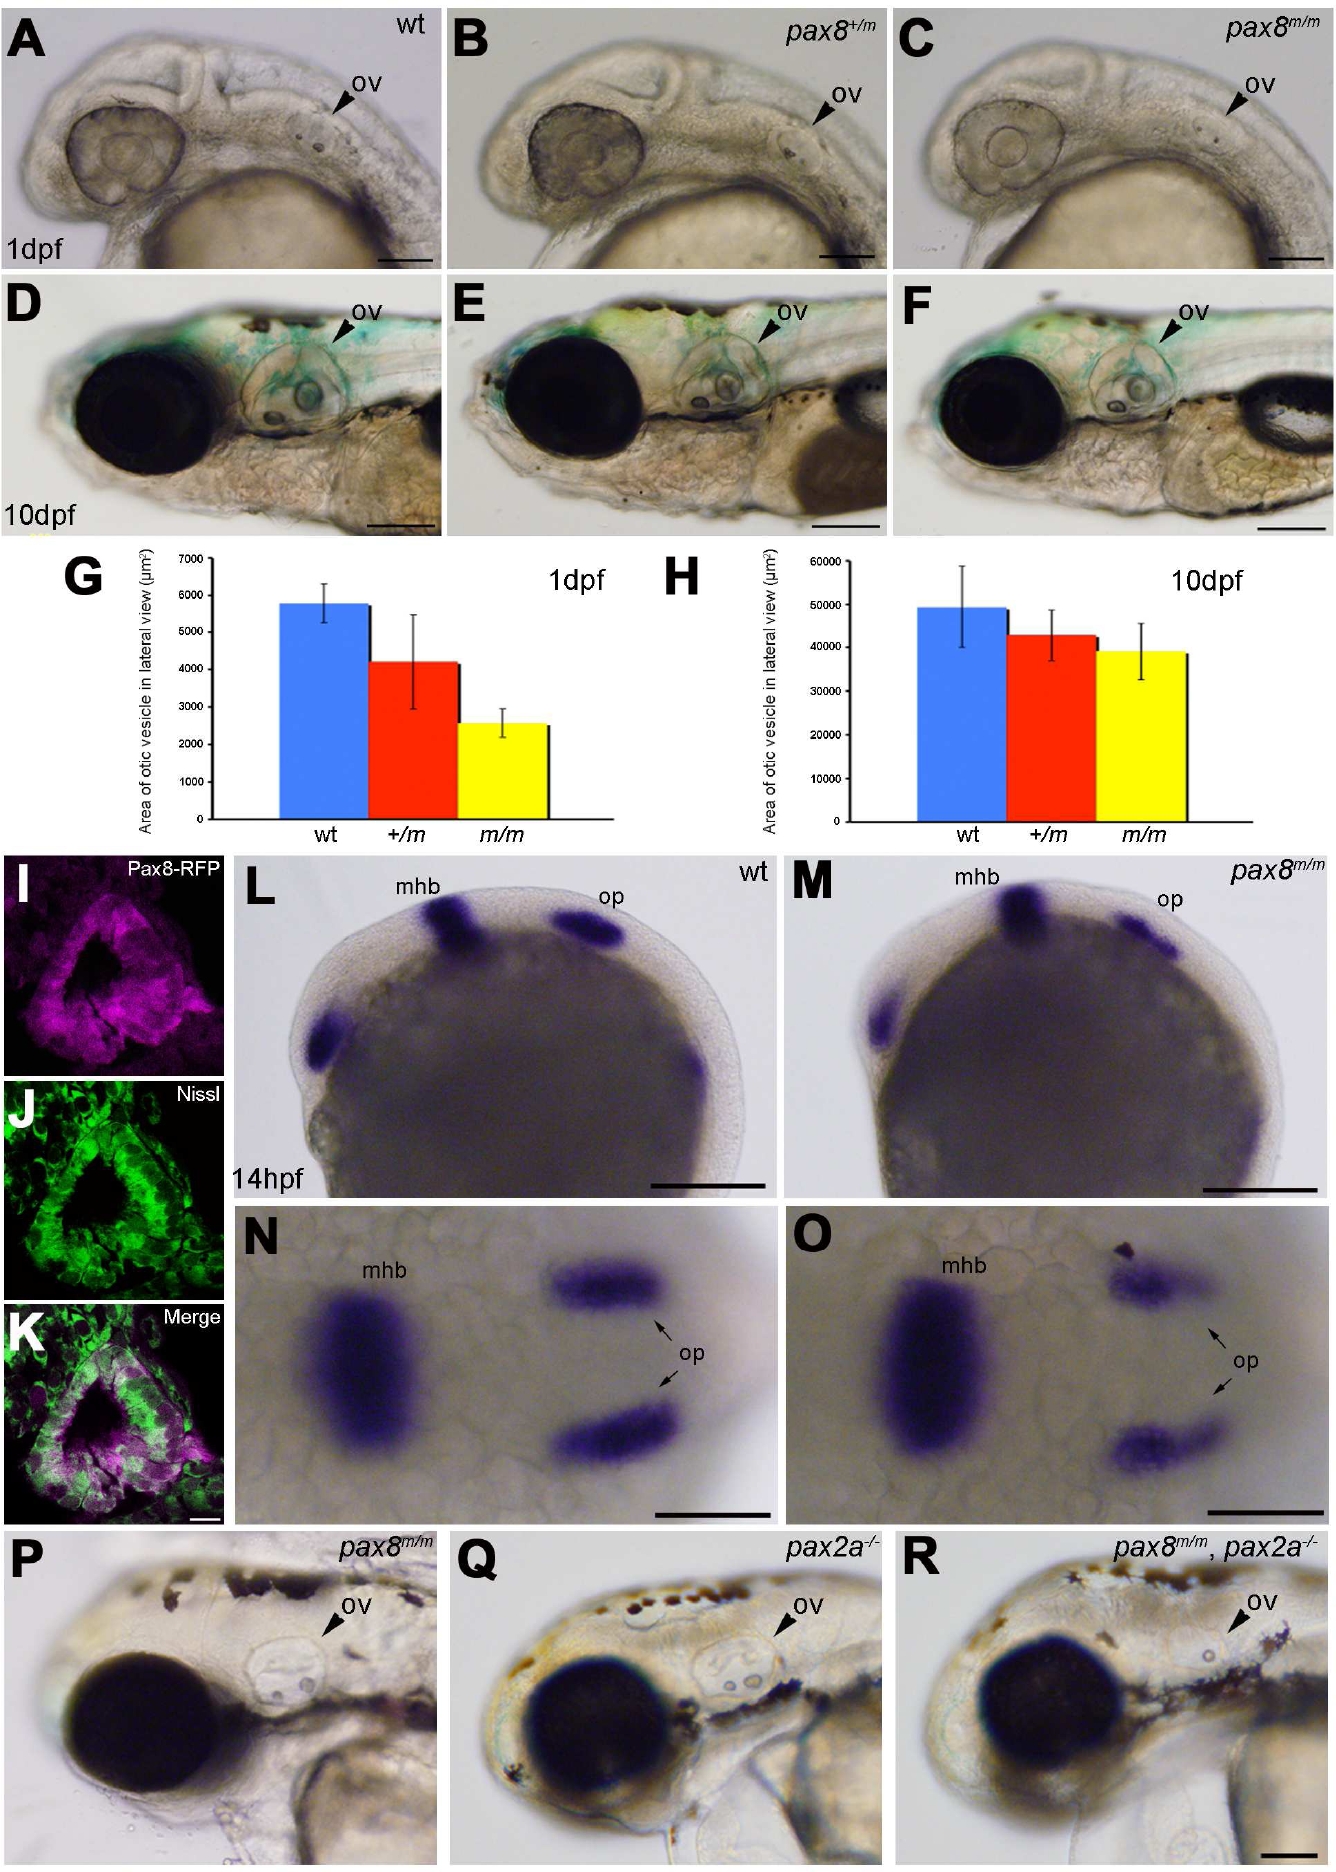
(Magenta-green version of Figure 4 for the assistance of color blind readers) Otic vesicle formation defects in pax2a/pax8 mutants. A-F: The otic vesicle (ov) size is slightly reduced in pax8m/m fish. Lateral view of the head region at 1 dpf (A, B, C) and 10 dpf (D, E, F). A and D are the wild type (wt), B and E are pax8+/m, and C and F are pax8m/m. Scale: 100 μm (A, B, C), 200 μm (D, E, F). G, H: The area of the otic vesicle as measured in the lateral view at 1 dpf (G) and 10 dpf (H). Wild type (Blue), pax8+/m (Red), and pax8m/m fish (Yellow). The average and the standard deviation are shown (n=6 each). I, J, K: C. RFP (+) cells (I) line the cavity of the otic vesicle, as visualized by the Nissle counterstain (J) at 1dpf. The merged picture is shown in K. Scale 10 μm. L-O: In situ hybridization with pax2a probes in wild type (L, N) and pax8m/m embryos (M, O) at 14 hpf. Pax2a expression is detected in retina, mhb and the otic placode (op) in wild type. Note the signal in the otic placode is weaker in pax8m/m embryo. The difference is more obvious in the higher magnification of the dorsal view (N and O). Scale: 200 μm (L, M), 100 μm (N, O). P, Q, R: The reduction of the otic vesicle size is more pronounced in the pax2a/pax8 double mutant. The lateral view of the head is shown for pax8m/m (P), pax2a-/- (Q) and pax2a/pax8 double mutant embryos at 2 dpf(R). Scale: 100 μm.