
Fig. 1
- ID
- ZDB-FIG-110624-6
- Publication
- Ikenaga et al., 2011 - Formation of the spinal network in zebrafish determined by domain-specific pax genes
- Other Figures
- All Figure Page
- Back to All Figure Page
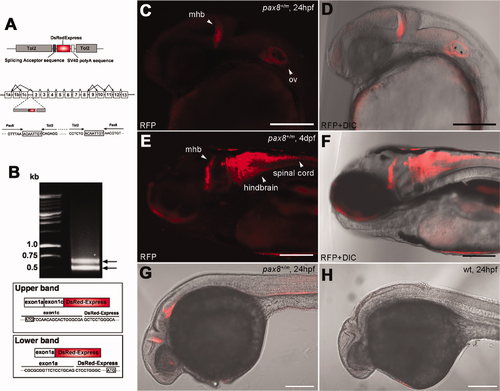
Insertion of RFP in the pax8 gene leads to RFP expression. A: Schematic diagram of the DNA construct used in the gene trap screening (top). The construct has a splicing acceptor site, DsRedExpress sequence, and the SV40 poly-A sequence. Tol2 sequences are at both ends. Exon composition of the pax8 gene in zebrafish is shown with possible alternative splicing combinations (middle). The insertion of the Tol2 sequence was detected in the first intron between exon 1c and exon 2. The nucleic acid sequence surrounding junctions is shown (bottom). Note the repeat of eight nucleic acids at both ends of the insertion, a phenomenon commonly observed with the Tol2 insertion. B: An electrophoresis image of RACE PCR products. Two distinct bands were detected. The upper band corresponded to the splicing of exons 1a and 1c and DsRed, whereas the lower band corresponded to the splicing between exon 1a and DsRed. Presumptive translation initiation site for each transcript is shown with a box. C,D: Confocal image of RFP signal in pax8+/m embryos at 24 hpf (C). The signal is detected at the midbrain–hindbrain boundary (mhb) and the otic vesicle (ov). D shows the merged image with transmitted light. E,F: At 4 dpf, the signal is detected also in the hindbrain and the spinal cord. F is the merged image with transmitted light. G,H: RFP antibody stains the mhb, otic vesicle and the kidney at 24 hpf (G). H is a wild-type embryo control. Scale bars = 200 μm. |