
- Title
-
Zebrafish diencephalic A11-related dopaminergic neurons share a conserved transcriptional network with neuroendocrine cell lineages
- Authors
- Löhr, H., Ryu, S., and Driever, W.
- Source
- Full text @ Development
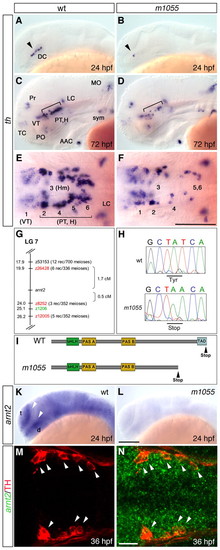
A mutation in arnt2 affects DA neuron groups in the ventral diencephalon of zebrafish. (A-F) Reduction of th-expressing DA neuron groups in the ventral diencephalon of m1055 mutants (B,D,F) compared with wild-type siblings (A,C,E) at 24 hpf (A,B) and 72 hpf (C-F). (G) Genetic mapping of the m1055 allele. SSLP markers (MGH panel black and T51 panel red) and genetic distances are shown. (H) Sequencing of arnt2 in m1055 mutants reveals a T to A exchange at position 1869. (I) Protein structure of the PAS family member arnt2. The premature stop codon in the m1055 allele disrupts the essential transactivation domain (TAD). (K,L) arnt2 is broadly expressed in wild type (K) at 24 hpf, but almost absent in m1055 mutants (L). (M,N) Fluorescent whole-mount in situ hybridization for arnt2 (green) combined with immunohistochemistry for TH (red) at 36 hpf. Arrowheads indicate co-expression. (A-D,K-L) Lateral views, (E,F,M,N) dorsal views, anterior towards the left. Scale bars: in F, 100 μm for E,F; in L, 100 μm for A-D,K,L; in N, 25 μm for M,N. AAC, arch associated cluster; d, diencephalon; DC, diencephalic cluster; H, hypothalamus; Hm, medial hypothalamus; LC, locus coeruleus; MO, medulla oblongata; PO, preoptic region; Pr, pretectum; PT, posterior tuberculum; sym, sympathetic CA neurons; t, telencephalon; TC, telencephalic cluster; VT, ventral thalamic cluster. Numbers in E,F indicate DA clusters in VT (1) and PT/H (2-6) according to Rink and Wullimann (Rink and Wullimann, 2002). EXPRESSION / LABELING:
PHENOTYPE:
|
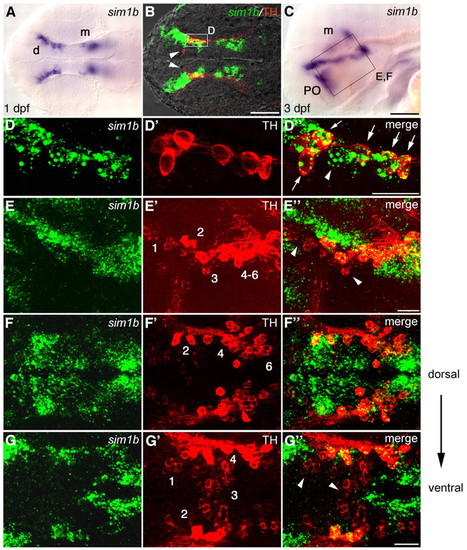
sim1b is expressed in a subset of DA neurons in the ventral diencephalon. (A-G″) Expression of sim1b (A,C) and co-expression of sim1b (fluorescent whole-mount in situ hybridization, green) and TH (B,D-G″; immunohistochemistry red). (A,B) 1 dpf. (C) sim1b expression at 3 dpf. (D-D″) Higher magnification of area framed in B. All TH-positive cells in this region co-express sim1b (arrows), whereas some sim1b-expressing cells are negative for TH (arrowheads). (E-E″) Higher magnification of area framed in C. DA neuron groups 2, 4-6 colocalize with sim1b; DA neuron groups 1 and 3 do not co-express sim1b (arrowheads). (F-G″) Dorsal views at 3 dpf in more dorsal (F-F″) and more ventral (G-G″) coronal optical sections. (A,B,F-G″) Dorsal views, (C-E″) lateral views, anterior towards the left. Scale bars: in C, 100 μm for A,C; in B, 100 μm; in D″,E″,G″, 50 μm for D-G″. Images in B,D-G″ are z-projections of multiple adjacent focal planes, depths (B,D) 12 μm, (E) 30 μm and (F,G) 20 μm. d, diencephalon; m, mesencephalon; PO, preoptic region. EXPRESSION / LABELING:
|
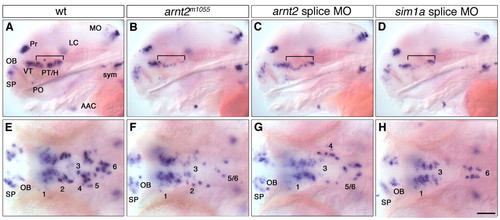
Similar reduction of DA cells in embryos injected with arnt2 or sim1a antisense morpholinos. (A-H) Expression of th at 4 dpf in uninjected wild-type embryos (A,E), arnt2m1055 mutants (B,F), embryos injected with 2.8 ng arnt2 splice morpholino (C,G) and embryos injected with 1.1 ng sim1a splice morpholino (D,H). (A-D) Affected groups are marked by a bracket. (E-H) Magnification of ventral diencephalic groups 1-6. (A-D) Lateral views; (E-H) dorsal views. Anterior towards the left. Scale bar in H: 100 μm for A-D, 50 μm for E-H. Images in E-H represent z-projections from several adjacent focal planes. AAC, arch associated cluster; LC, locus coeruleus; MO, medulla oblongata; OB, olfactory bulb; PO, preoptic region; Pr, pretectum; PT, posterior tuberculum; SP, subpallium; sym, sympathetic CA neurons; VT, ventral thalamic cluster. |
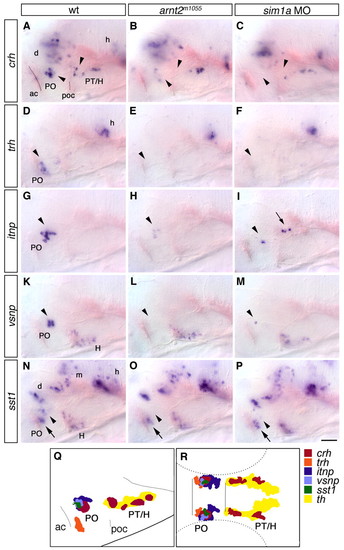
Reduction of neurohormone-producing cells in the hypothalamus of arnt2m1055 mutants and sim1a morphants. (A-P) Expression of crh (A-C), trh (D-F), itnp (G-I), vsnp (K-M) and sst1 (N-P) at 76 hpf in wild-type embryos (A,D,G,K,N), arnt2m1055 mutants (B,E,H,L,O) and embryos injected with 1 ng sim1a morpholino (C,F,I,M,P). (A-C) crh neurons in the PO (lower arrowheads) and in the posterior tuberculum and hypothalamus (upper arrowheads) are reduced. (D-F) trh-expressing cells in the PO (arrowheads) are strongly reduced. (G-I) itnp-expressing cells in the PO (arrowheads) are strongly reduced or absent. In sim1a morphants, itnp-expressing cells are detected at ectopic locations within the diencephalon (arrow). (K-M) vsnp-expressing cells in the PO (arrowheads) are strongly reduced or absent. (N-P) A group of sst1-expressing cells in the PO (arrowheads) is strongly reduced or absent, whereas all other sst1-positive domains, including a second group in the PO (arrow) are not affected. (Q,R) Camera lucida drawing showing the relative position of all analyzed neuronal groups reduced in arnt2 mutants or sim1a morphants in lateral (Q) or dorsal (R) views; non-affected neuronal groups are not included. (A-P) Whole-mount in situ hybridization, lateral views; anterior is towards the left. Scale bar in P: 50 μm for A-P. Images represent z-projections from several consecutive focal planes. ac, anterior commissure; d, diencephalon; h, hindbrain; H, hypothalamus; m, mesencephalon; PO, preoptic region; poc, post optic commissure; PT, posterior tuberculum. EXPRESSION / LABELING:
PHENOTYPE:
|
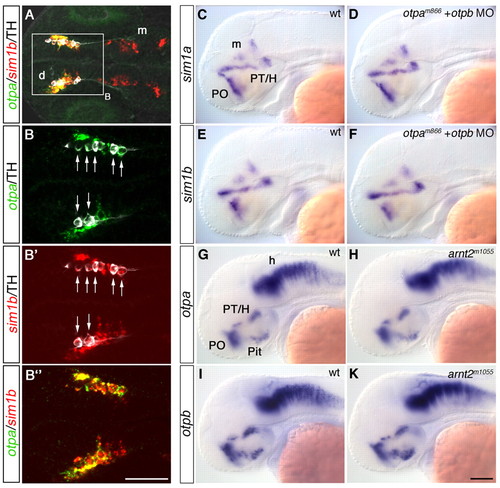
Mutually independent expression of sim1 and otp genes in DA neurons. (A-B″) Detection of otpa (green) and sim1b (red) expression by fluorescent whole-mount in situ hybridization combined with immunohistochemistry for TH (white) at 1 dpf. (A) THir cells are located within an otpa- and sim1b-expressing domain in the diencephalon (z-projection, 16 μm). (B-B″) Higher magnification of area framed in A (z-projection 10 μm). All THir cells co-express both otpa and sim1b (arrows in B,B′). (C-F) Expression analysis of sim1a (C,D) and sim1b (E,F) in wild-type embryos (C,E) and in otpam866 homozygous mutants injected with 2 ng otpb morpholino (D,F) at 2 dpf. (G-K) Expression analysis of otpa (G,H) and otpb (I-K) in wild-type (G,I) and in arnt2m1055 (H,K) embryos at 2 dpf. (A-B″) Dorsal, (C-K) lateral views. Anterior towards the left. Scale bars: in B″, 100 μm for A, 50 μm for B-B″; in K, 100 μm for C-K. d, diencephalon; h, hindbrain; H, hypothalamus; m, mesencephalon; Pit, pituitary; PO, preoptic region; PT, posterior tuberculum. |
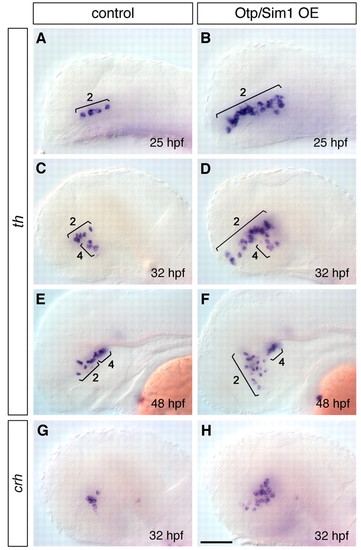
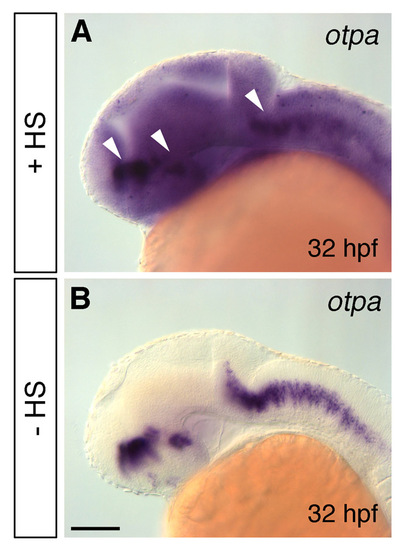
Combined overexpression of Otpa and Sim1a leads to supernumerary DA and CRH cells in the ventral diencephalon. (A-H) Whole-mount in situ hybridization. Expression of th at 24 hpf (A,B), 32 hpf (C,D) and 48 hpf (E,F), and crh at 32 hpf (G,H) in wild-type controls (A,C,E,G) compared with transgenic embryos expressing otpa from a hsp70 promoter, and injected with sim1a mRNA (Otp/Sim1OE; B,D,F,H). Only the number of group 2 cells is strongly increased in Otp/Sim1OE embryos, whereas groups 4/6 are not affected (A-F). The number of CRH cells is increased in Otp/Sim1OE embryos (G,H). Lateral views, anterior towards the left. Scale bar: 50 μm for A,B; 62.5 μm for C,D,G,H; 80 μm for E,F. |
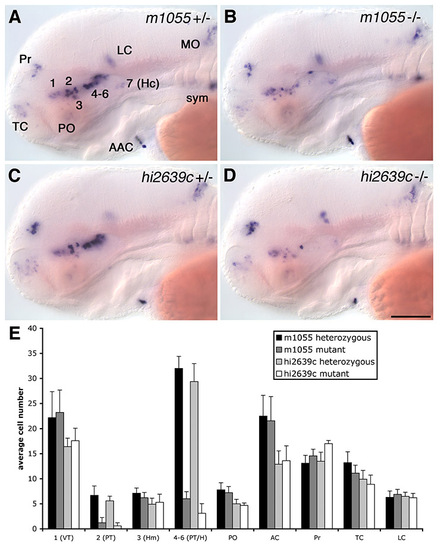
Comparison of DA cell reduction in arnt2m1055 and arnt2hi2639c. (A-D) th expression at 72 hpf in arnt2m1055 heterozygous siblings (A), arnt2m1055 homozygous mutants (B), arnt2hi2639c heterozygous siblings (C) and arnt2hi2639c homozygous mutants (D). (E) Average number of th-positive cells in distinct groups at 72 hpf in arnt2m1055 heterozygous siblings, arnt2m1055 homozygous mutants, arnt2hi2639c heterozygous siblings and arnt2hi2639c homozygous mutants. Cells of ventral diencephalic groups 2, 4-6 are significantly reduced to a very similar extent in the two different mutant arnt2 alleles. Cells were counted unilaterally in a total of 20 embryos for each genotype. (A-D) Lateral views. Anterior is towards the left. Scale bar: in D, 100 μm for A-D. Abbreviations: AAC, arch associated cluster; Hc, caudal hypothalamus; LC, locus coeruleus; MO, medulla oblongata; PO, preoptic region; Pr, pretectum; sym, sympathetic neurons; TC, telencephalic cluster. |
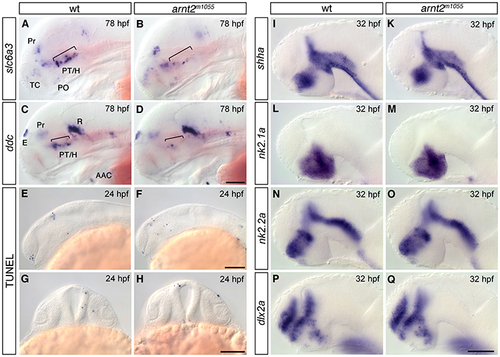
Forebrain development is largely normal in arnt2m1055 mutants. (A,B) Expression analysis of slc6a3/dat by whole-mount in situ hybridization at 78 hpf revealing reduction of slc6a3/dat-expressing cells in the ventral diencephalon of arnt2m1055 mutants (B) compared with wild-type embryos (A, brackets). Other slc6a3-expressing cells located in the telencephalon, pretectum and preoptic region are not affected. (C,D) Expression analysis of ddc by whole-mount in situ hybridization at 78 hpf revealing reduction of ddc-expressing cells in the ventral diencephalon of arnt2m1055 mutants (D) compared with wild-type embryos (C, brackets) but not in the epiphysis, pretectum, arch-associated neurons or raphe nuclei. (E-H) TUNEL at 24 hpf reveals that apoptosis is not increased in arnt2m1055 mutants (F,H) compared with wild-type siblings (E,G). (I-Q) Expression analysis of shha (I,K), nk2.1a (L,M), nk2.2a (N,O) and dlx2a (P,Q) at 32 hpf reveals no significant change in their expression in arnt2m1055 mutants (K,M,O,Q) compared with wild-type embryos (I,L,N,P). (A-F,I-Q) Lateral views, anterior is towards the left; (G-H) frontal views. Scale bars: in D, 100 μm for A-D; in F, 100 μm for E,F; in H, 100 μm for (G,H); in Q, 50 μm for I-Q. Abbreviations: AAC, arch associated cluster; E, epiphysis; H, hypothalamus; PO, preoptic region; Pr, pretectum; PT, posterior tuberculum; R, raphe nuclei; TC, telencephalic clusters. |

Comparison of sim1a and sim1b expression in the embryonic brain. (A-F) Expression of sim1a (A-C) and sim1b (D-F) at 1 dpf (A,D), 2 dpf (B,E) and 3 dpf (C,F). Both sim1a and sim1b are expressed in the telencephalon, diencephalon and ventral midbrain in a highly similar pattern. (G-H″) Double fluorescent whole-mount in situ hybridization to detect coexpression of sim1a (G,H, red) and sim1b (G′,H′, green) at 1 dpf (G-G″, z-projection 30 μm) and 2 dpf (H-H″, z-projection 30 μm) revealing highly similar expression of both genes in all domains (merge views, G″,H″). (A-F,H-H″) Lateral views; (G-G″) dorsal views. Anterior is towards the left. Scale bars: in F, 100 μm for A-F; in H″, 50 μm for G-H″. Images in G,H″ represent z-projections from multiple adjacent confocal planes. Abbreviations: d, diencephalon; H, hypothalamus; m, mesencephalon; PO, posterior tuberculum; PO, preoptic region; t, telencephalon. |
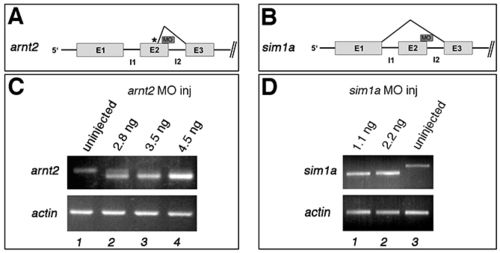
arnt2 and sim1 morpholinos effectively block correct splicing of pre-mRNA. (A) Schematic figure showing the first three exons and introns of the arnt2 gene and the splice morpholino targeting the exon2-intron2 boundary used in this study. A cryptic splice site in exon2 (depicted by an asterisk) causes deletion of 19 basepairs of the 3′ end of exon2, leading to a frameshift and a truncated Arnt2 protein. (B) Schematic figure showing the first three exons and introns of the sim1a gene and the splice morpholino targeting the exon2-intron2 boundary of sim1a. The morpholino leads to a complete loss of exon2 (83 basepairs). (C) RT-PCR from uninjected embryos (lane 1) and from embryos injected with 2.8 ng (lane 2), 3.5 ng (lane 3) or 4.5 ng (lane 4) arnt2 splice morpholino showing dose-dependent downregulation of wild-type splice pattern arnt2 transcript in injected embryos. The amount of actin transcript is unchanged. (D) RT-PCR from uninjected embryos (lane 1) and from embryos injected with 1.1 ng (lane 2) or 2.2 ng (lane 3) sim1a splice morpholino showing dose-dependent downregulation of wild-type splice pattern sim1a transcript in injected embryos. The amount of actin transcript is unchanged. |
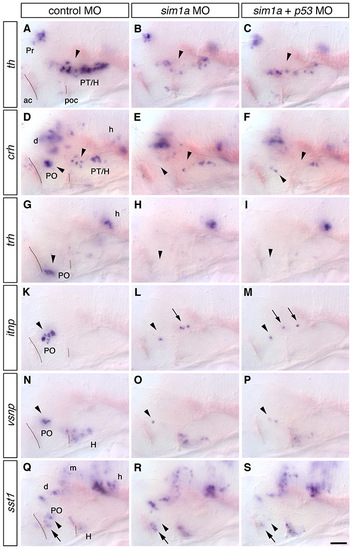
The loss of specific neuronal subtypes in sim1a morphants is not due to p53-dependent cell death. (A-S) Expression of tyrosine hydroxylase (th, A-C), corticotropin releasing hormone (crh, DF), thyrotropin releasing hormone (trh, G-I), isotocin neurophysin (itnp, K-M), vasotocin neurophysin (vsnp, N-P) and somatostatin1 (sst1, Q-S) at 76 hpf in embryos injected either with 4.5 ng control morpholino (A,D,G,K,N,Q), 1 ng sim1a splice MO alone (B,E,H,L,O,R) or 1 ng sim1a splice MO together with 7 ng p53 ATG MO (C,F,I,M,P,S). The level of reduction in cell number is identical for all analyzed neuronal subtypes in embryos injected with sim1a morpholino alone (arrowheads in B,E,H,L,O,R) or co-injected with p53MO (arrowheads in C,F,I,M,P,S). Arrows indicate ectopic itnp cells (L-M). (A-S) Lateral views; anterior is towards the left. Scale bar: 50 μm. Images represent z-projections from single planes for an better overview. Abbreviations: ac, anterior commissure; d, diencephalon; m, mesencephalon; h, hindbrain; H, hypothalamus; poc, post optic commissure; PO, preoptic region; PT, posterior tuberculum. |
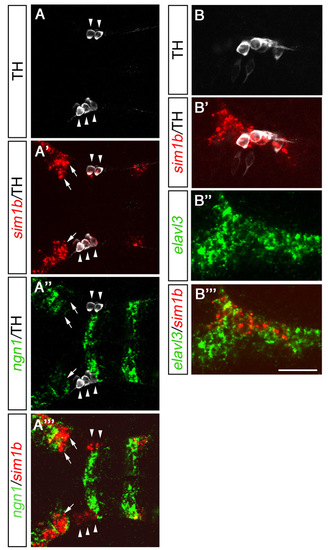
sim1b is expressed in differentiating neurons. (A-A″′) Detection of neurogenin1 (ngn1; green) and sim1b (red) expression by fluorescent whole-mount in situ hybridization combined with immunohistochemistry for TH (white) at 1 dpf (z-projection, 6 μm). All THir cells co-express sim1b (A′) but not ngn1 (A″; see arrowheads A-A″′). Sim1b expression is only detectable in cells that express very low levels of ngn1 or cell that do not express ngn1 at all (A″′; see arrows A′-A″′). (B-B″′) Fluorescent whole-mount in situ hybridization for elavl3 (huC; green) and sim1b (red) combined with immunohistochemistry for TH (white) at 1 dpf. All sim1b-positive cells co-express elavl3 (B″′). (A-B″′) Lateral views. Anterior is towards the left. Scale bars: 62.5 μm in A-A″′; 50 μm in B-B″″. A-A″′ represent z-projections of single focal planes. Images in B-B″′ represent a single focal plane. |
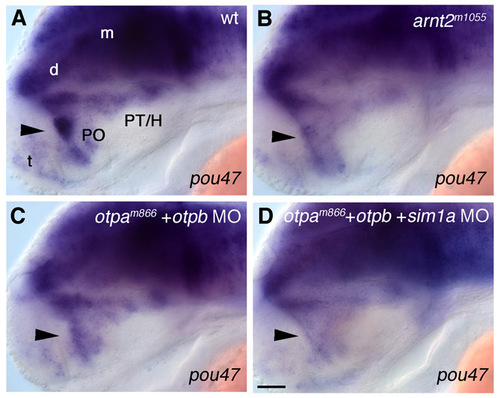
Reduction of pou47 expression in the anterior hypothalamus of embryos lacking Otp or Arnt2/Sim1 function. (A-D) Expression of pou47 at 48 hpf in wild-type (A), arnt2m1055 embryos (B), otpam866 embryos injected with 2 ng otpb morpholino (C) and otpam866 embryos co-injected with 2 ng otpb together with 1 ng sim1a morpholino (D). In embryos lacking Arnt2/Sim1 function (B), Otp function (C) or function of both Otp and Arnt2/Sim1 (D), the expression of pou47 in the preoptic area is strongly reduced compared with that in wild type (A, see arrowheads), whereas the expression in the ventral diencephalon corresponding to the area where ventral diencephalic dopaminergic groups are formed is only slightly reduced. (A-D) Lateral views. Anterior is towards the left. Scale bar: 50 μm. Abbreviations: d, diencephalon; H, hypothalamus; m, mesencephalon; PO, preoptic region; PT, posterior tuberculum; t, telencephalon. |
Analysis of otpa overexpression in hs:otpa transgenic fish. (A,B) Whole-mount in situ hybridization for otpa in hs:otpa transgenic embryos at 32 hpf; heatshocks performed at 9 hpf and 28 hpf for 1 hour at 39°C results in ubiquitous otpa expression (A), whereas non-heatshocked embryos display endogenous otpa expression only (B). The endogenous otpa signal in heatshocked embryos is still stronger than otpa signal from the transgene (arrowheads in A). (A,B) Lateral views; anterior is towards the left. Scale bar: 100 μm for A,B. |

Analysis of early forebrain patterning in embryos overexpressing Otpa and/or Sim1a. (A-Q) Expression analysis of dlx2 (A-D), nkx2.1a (E-H), pitx3 (I-M) and shha (N-Q) in Otp/Sim1OE, OtpOE, Sim1OE and control embryos at 24 hpf. None of the tested markers shows altered expression in the different experimental embryos. (A-Q) Lateral views; anterior is towards the left. Scale bar: 100 μm. |
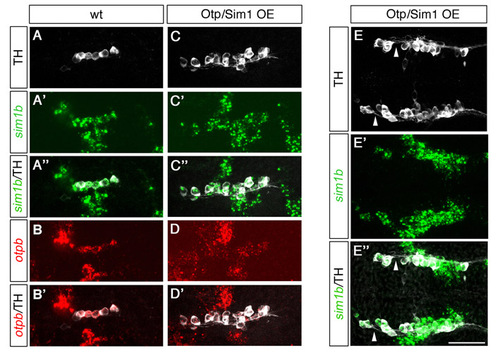
Supernumerary DA neurons in Otp/Sim1OE embryos express both otp and sim1. (A-E″) Expression of sim1b (whole-mount in situ hybridization, green), otpb (whole-mount in situ hybridization, red) and TH (immunostaining, white) at 25 hpf in wild-type control (A-B′) and transgenic embryos expressing otpa from the hsp70 promoter co-injected with sim1a mRNA (Otp/Sim1OE; C-E″). Lateral view of the region of DA specification in the posterior tuberculum/hypothalamus in wild-type embryos showing co-expression of TH with sim1b (A-A″) as well as with otpb (B-B′). Lateral view of the same brain region in an Otp/Sim1OE embryo showing supernumerary ectopic TH cells (total of 16 cells) that are arranged in a rostrocaudally elongated expression domain but still express sim1b (C-C″) and otpb (D-D′), reflecting the expanded sim1b/otpb expression domains. (E-E″) Dorsal view of TH cells in an Otp/Sim1OE embryo showing that ectopic, anteriorly located TH/sim1b-positive cells send projections caudally where they join the regular DA axonal tracts (arrowheads in E,E″). Anterior is towards the left. Scale bars: 50 μm. Fluorescent images in represent z-projections from single focal planes: (A-D′) 20 μm; (E-E″) 40 μm. |