
Image
|
Figure Caption
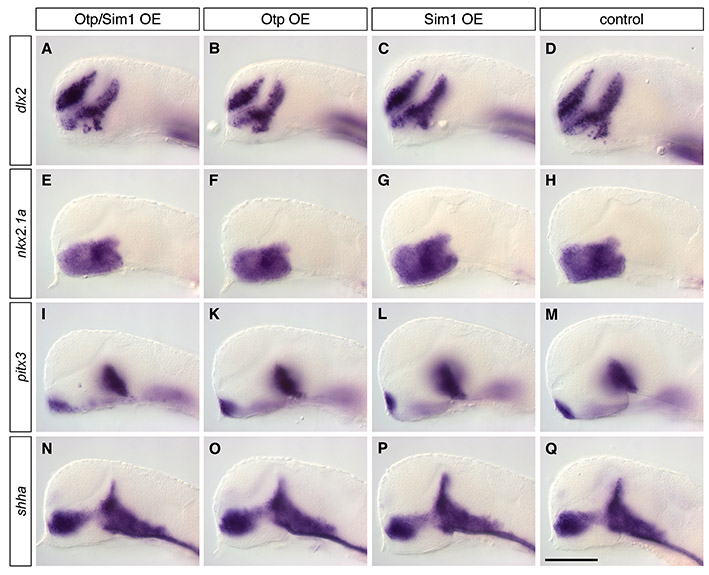
Fig. S10 Analysis of early forebrain patterning in embryos overexpressing Otpa and/or Sim1a. (A-Q) Expression analysis of dlx2 (A-D), nkx2.1a (E-H), pitx3 (I-M) and shha (N-Q) in Otp/Sim1OE, OtpOE, Sim1OE and control embryos at 24 hpf. None of the tested markers shows altered expression in the different experimental embryos. (A-Q) Lateral views; anterior is towards the left. Scale bar: 100 μm.
Acknowledgments
This image is the copyrighted work of the attributed author or publisher, and
ZFIN has permission only to display this image to its users.
Additional permissions should be obtained from the applicable author or publisher of the image.
Full text @ Development