
|
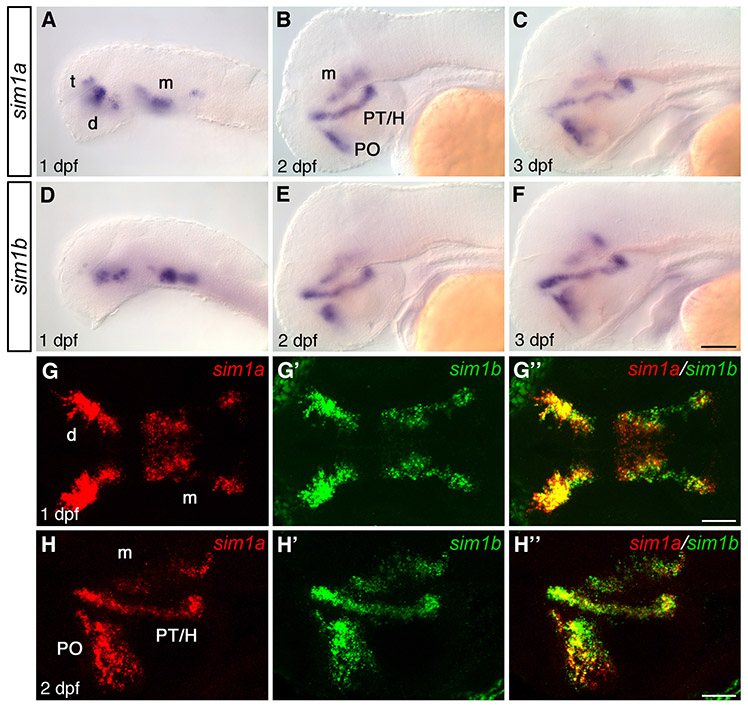
Fig. S4 Comparison of sim1a and sim1b expression in the embryonic brain. (A-F) Expression of sim1a (A-C) and sim1b (D-F) at 1 dpf (A,D), 2 dpf (B,E) and 3 dpf (C,F). Both sim1a and sim1b are expressed in the telencephalon, diencephalon and ventral midbrain in a highly similar pattern. (G-H″) Double fluorescent whole-mount in situ hybridization to detect coexpression of sim1a (G,H, red) and sim1b (G′,H′, green) at 1 dpf (G-G″, z-projection 30 μm) and 2 dpf (H-H″, z-projection 30 μm) revealing highly similar expression of both genes in all domains (merge views, G″,H″). (A-F,H-H″) Lateral views; (G-G″) dorsal views. Anterior is towards the left. Scale bars: in F, 100 μm for A-F; in H″, 50 μm for G-H″. Images in G,H″ represent z-projections from multiple adjacent confocal planes. Abbreviations: d, diencephalon; H, hypothalamus; m, mesencephalon; PO, posterior tuberculum; PO, preoptic region; t, telencephalon.