
Fig. 5
|
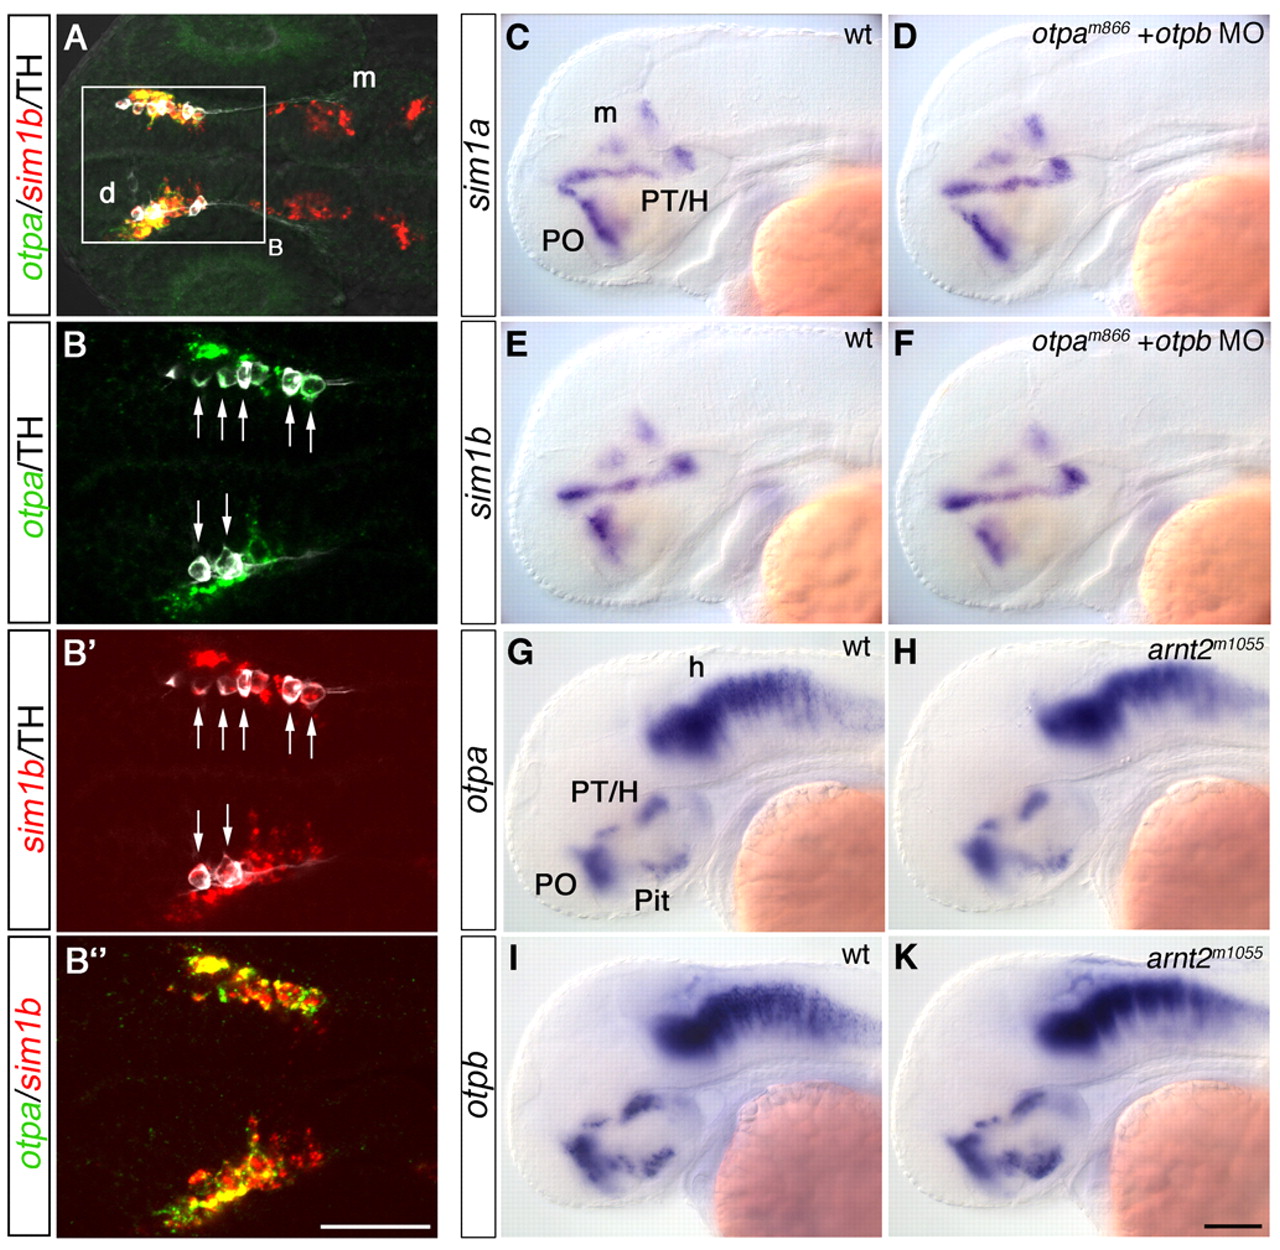
Fig. 5 Mutually independent expression of sim1 and otp genes in DA neurons. (A-B″) Detection of otpa (green) and sim1b (red) expression by fluorescent whole-mount in situ hybridization combined with immunohistochemistry for TH (white) at 1 dpf. (A) THir cells are located within an otpa- and sim1b-expressing domain in the diencephalon (z-projection, 16 μm). (B-B″) Higher magnification of area framed in A (z-projection 10 μm). All THir cells co-express both otpa and sim1b (arrows in B,B′). (C-F) Expression analysis of sim1a (C,D) and sim1b (E,F) in wild-type embryos (C,E) and in otpam866 homozygous mutants injected with 2 ng otpb morpholino (D,F) at 2 dpf. (G-K) Expression analysis of otpa (G,H) and otpb (I-K) in wild-type (G,I) and in arnt2m1055 (H,K) embryos at 2 dpf. (A-B″) Dorsal, (C-K) lateral views. Anterior towards the left. Scale bars: in B″, 100 μm for A, 50 μm for B-B″; in K, 100 μm for C-K. d, diencephalon; h, hindbrain; H, hypothalamus; m, mesencephalon; Pit, pituitary; PO, preoptic region; PT, posterior tuberculum.