- Title
-
Mutations in the microexon splicing regulator srrm4 have minor phenotypic effects on zebrafish neural development
- Authors
- Gupta, T., Margolin, G., Burgess, H.A.
- Source
- Full text @ G3 (Bethesda)
|
Zebrafish srrm4 has 2 annotated transcript variants and encodes a protein with a conserved eMIC domain. a) srrm4 transcript variants. Transcript variant 1 (NM_001423807.1) encodes the longer isoform of the Srrm4 protein, which contains the eMIC domain. Transcript variant 2 (XM_021476416.1) has a 16 nt microexon near the 3′ end that creates a frame-shift, resulting in a truncated protein lacking the eMIC domain. The asterisk indicates microexon. Gray shading indicates untranslated regions. b) Sequence alignment of longest isoforms of human, mouse, and zebrafish SRRM4/Srrm4 proteins. The black box outlines the conserved eMIC domain. |
|
Srrm4 is expressed in proliferating notch1a and differentiated elavl3 neurons during early brain development. a–d) Partial (20 μm depth) maximum intensity projections of srrm4 mRNA expression at 24 and 48 hpf. Dorsal view in (a) and sagittal view in (b) at 24 hpf. Dorsal view in (c) and sagittal view in (d) at 48 hpf. Anterior is to the left. Scale bars = 100 μm. e–e″) Single plane image of Mo of srrm4 co-labeled with notch1a mRNA at 48 hpf. e) srrm4 expression. e′) notch1a expression. e″) srrm4 and notch1a merged images. f–f″) Single plane image of Mo of srrm4 co-labeled with elavl3 mRNA at 48 hpf. f) srrm4 expression. f′) elavl3 expression. f″) srrm4 and elavl3 merged images. Areas of overlap, which appear yellow, indicate presumed co-localization. Scale bars = 50 μm. Cb, cerebellum; Di, diencephalon; Mo, medulla oblongata; Oe, olfactory epithelium; Ot, optic tectum; Te, telencephalon. |
|
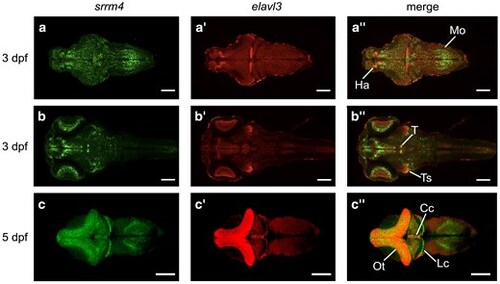
Srrm4 is dynamically expressed at 3 and 5 dpf. a–b″) Single plane images of srrm4 and elavl3 mRNA expression at 3 dpf in 2 focal planes (3 brains averaged). Dorsal views of srrm4 (a, b), elavl3 (a′, b′), and srrm4 and elavl3 merged (a″, b″). c–c″) srrm4 and elavl3 mRNA expression at 5 dpf (5 brains averaged). Dorsal views of srrm4 (c), elavl3 (c′), and srrm4 and elavl3 merged (c″). Areas of overlap, which appear yellow, indicate presumed co-localization. Anterior is to the left. Scale bars = 100 μm. Cc, corpus cerebelli; Ha, habenula; Lc, lobus caudalis; Mo, medulla oblongata; Ot, optic tectum; T, tegmentum; Ts, torus semicircularis. EXPRESSION / LABELING:
|
|
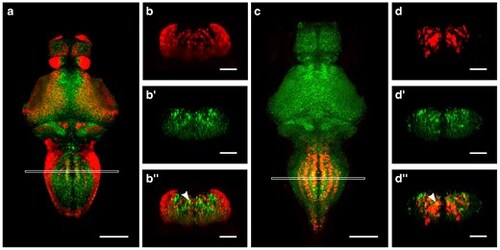
Srrm4 partially co-localizes with glutamatergic and glycinergic neuron markers in the medulla. a–b″) srrm4 mRNA and vglut2a:GFP transgene expression at 4 dpf. a) Dorsal view of single plane image showing srrm4 and vglut2a:GFP expression (5 brains averaged). The white box indicates the area of maximum intensity projection shown in (b–b″) from a single representative brain. Coronal views of vglut2a:GFP (b), srrm4 (b′), and vglut2a:GFP and srrm4 merged (b″). c–d″) srrm4 mRNA and glyt2 expression at 4 dpf. c) Dorsal view of single plane image showing srrm4 and glyt2 expression (5 brains averaged). The white box indicates the area of maximum intensity projection shown in (d–d″) from a single representative brain. Coronal views of glyt2 (d), srrm4 (d′), and glyt2 and srrm4 merged (d″). Scale bars in (a) and (c) = 100 μm. Scale bars in (b–b″) and (d–d″) = 50 μm. Arrowheads point to examples of co-localization. |
|
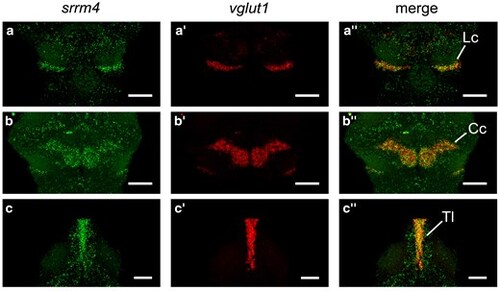
Srrm4 co-localizes with the granule cell marker vglut1. a–c″) srrm4 and vglut1 mRNA expression at 6 dpf. a–a″) Dorsal view of the lobus caudalis showing srrm4 (a), vglut1 (a′), and srrm4 and vglut1 merged (a″). b–b″) Dorsal view of the corpus cerebelli showing srrm4 (b), vglut1 (b′), and srrm4 and vglut1 merged (b″). c–c″) Dorsal view of the torus longitudinalis showing srrm4 (c), vglut1 (c′), and srrm4 and vglut1 merged (c″). Anterior is to the top. Scale bars = 50 μm. Cc, corpus cerebelli; Lc, lobus caudalis; Tl, torus longitudinalis. EXPRESSION / LABELING:
|
|
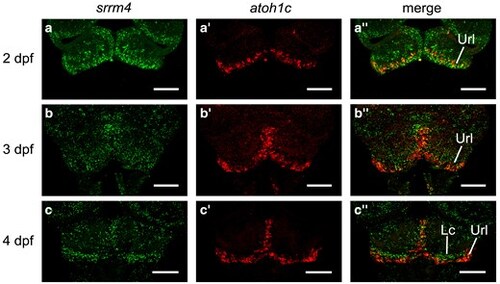
Srrm4 co-localizes with atoh1c in the Url. a–c″) srrm4 and atoh1c mRNA expression at 2–4 dpf. a–a″) Partial maximum intensity projection of Url at 2 dpf showing srrm4 (a), atoh1c (a′), and srrm4 and atoh1c merged (a″). b–b″) Partial maximum intensity projection of Url at 3 dpf showing srrm4 (b), atoh1c (b′), and srrm4 and atoh1c merged (b″). c–c″) Partial maximum intensity projection of Url and lobus caudalis at 4 dpf showing srrm4 (c), atoh1c (c′), and srrm4 and atoh1c merged (c″). Dorsal views. Anterior is to the top. Scale bars = 50 μm. Lc, lobus caudalis; Url, upper rhombic lip. |
|
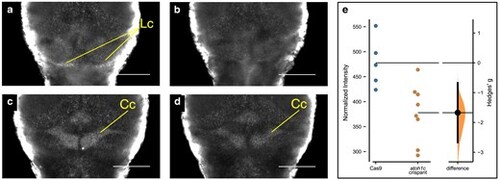
Srrm4 expression is decreased in atoh1c G0 crispant larvae at 6 dpf. a, b) srrm4 expression in the lobus caudalis. a) Cas9-injected control and (b) atoh1c G0 crispant. c, d) srrm4 expression in the corpus cerebelli. c) Cas9-injected control. d) atoh1c G0 crispant. e) Quantification of srrm4 expression in atoh1c crispant and Cas9-injected control larvae. Each point represents the normalized srrm4 expression level of an individual larva. Student's t-test P = 0.009. Anterior is to the top. Cc, corpus cerebelli; Lc, lobus caudalis. Scale bar = 100 μm. |
|
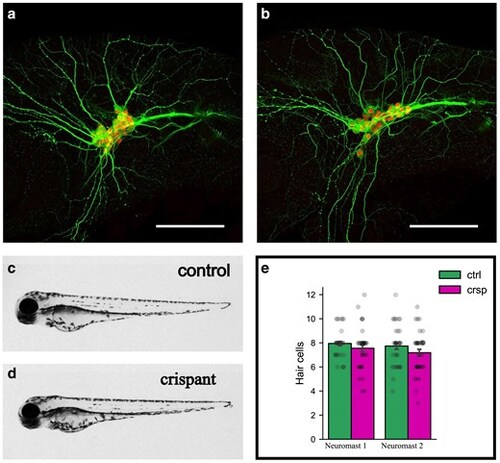
Srrm4 G0 crispants do not recapitulate morphant phenotypes. a, b) Maximum intensity projections of sagittal sections showing acetylated tubulin and Islet 1 antibody staining in trigeminal neurons of wild-type (a) and srrm4y712 homozygous mutants (b) at 30 hpf. Acetylated tubulin, in green, marks developing neurites and Islet 1, in red, marks trigeminal neuron cell bodies. c, d) srrm4 G0 crispant and Cas9-injected control larvae at 3 dpf showing overall body morphology. c) Cas9-injected larva and (d) srrm4 G0 crispant larva. Anterior is to the left in all panels. e) Hair cell numbers from 2 neuromasts per larva in Cas9-injected controls (ctrl) vs srrm4 G0 crispants (crsp) at 3 dpf. Each dot represents the number of hair cells from an individual neuromast. N = 38 larvae per group. PHENOTYPE:
|
|
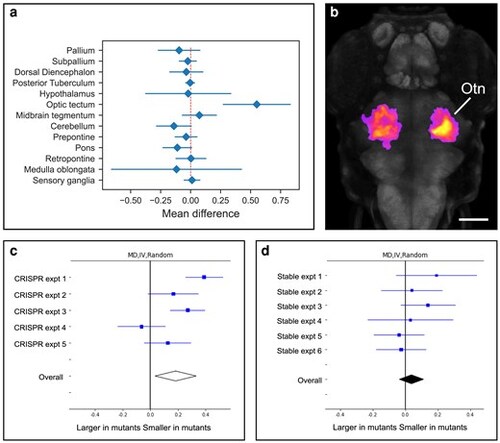
Srrm4 G0 crispants display a reduced optic tectum neuropil phenotype not observed in stable mutants. a) Plot showing the mean percent size difference between crispant and control larvae within major brain divisions at 6 dpf. b) Dorsal view of maximum intensity projection of voxels showing a significant reduction in volume in srrm4 G0 crispant larvae at 6 dpf based on cluster analysis (fire). Gray staining shows pan-neuronal expression of elavl3. Anterior is to the top. Otn, optic tectum neuropil. Scale bar = 100 μm. c, d) Forest plots depicting random model meta-analyses of srrm4 morphometry experiments. c) srrm4 G0 crispant experiments and (d) and srrm4 stable mutant experiments. Details of conditions for each experiment are provided in Table 1. PHENOTYPE:
|


