
Fig. 4
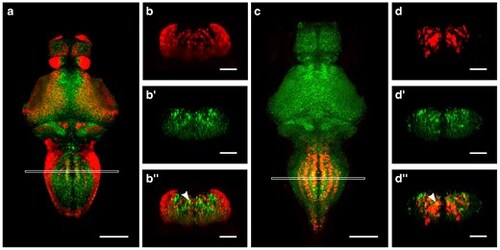
Srrm4 partially co-localizes with glutamatergic and glycinergic neuron markers in the medulla. a–b″) srrm4 mRNA and vglut2a:GFP transgene expression at 4 dpf. a) Dorsal view of single plane image showing srrm4 and vglut2a:GFP expression (5 brains averaged). The white box indicates the area of maximum intensity projection shown in (b–b″) from a single representative brain. Coronal views of vglut2a:GFP (b), srrm4 (b′), and vglut2a:GFP and srrm4 merged (b″). c–d″) srrm4 mRNA and glyt2 expression at 4 dpf. c) Dorsal view of single plane image showing srrm4 and glyt2 expression (5 brains averaged). The white box indicates the area of maximum intensity projection shown in (d–d″) from a single representative brain. Coronal views of glyt2 (d), srrm4 (d′), and glyt2 and srrm4 merged (d″). Scale bars in (a) and (c) = 100 μm. Scale bars in (b–b″) and (d–d″) = 50 μm. Arrowheads point to examples of co-localization. |