
Image
|
Figure Caption
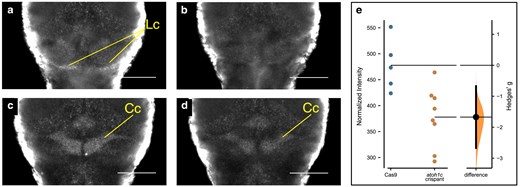
Fig. 7 Srrm4 expression is decreased in atoh1c G0 crispant larvae at 6 dpf. a, b) srrm4 expression in the lobus caudalis. a) Cas9-injected control and (b) atoh1c G0 crispant. c, d) srrm4 expression in the corpus cerebelli. c) Cas9-injected control. d) atoh1c G0 crispant. e) Quantification of srrm4 expression in atoh1c crispant and Cas9-injected control larvae. Each point represents the normalized srrm4 expression level of an individual larva. Student's t-test P = 0.009. Anterior is to the top. Cc, corpus cerebelli; Lc, lobus caudalis. Scale bar = 100 μm.
Figure Data
Acknowledgments
This image is the copyrighted work of the attributed author or publisher, and
ZFIN has permission only to display this image to its users.
Additional permissions should be obtained from the applicable author or publisher of the image.
Full text @ G3 (Bethesda)