
|
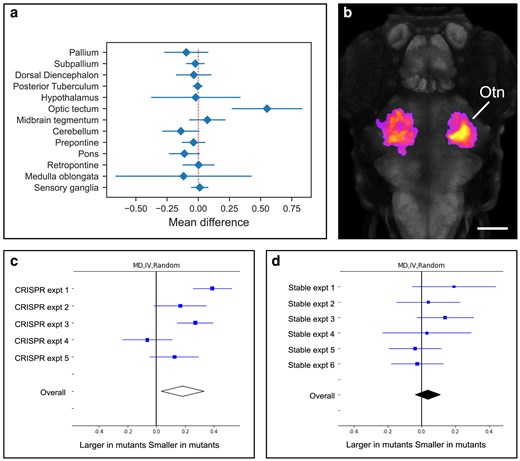
Fig. 9 Srrm4 G0 crispants display a reduced optic tectum neuropil phenotype not observed in stable mutants. a) Plot showing the mean percent size difference between crispant and control larvae within major brain divisions at 6 dpf. b) Dorsal view of maximum intensity projection of voxels showing a significant reduction in volume in srrm4 G0 crispant larvae at 6 dpf based on cluster analysis (fire). Gray staining shows pan-neuronal expression of elavl3. Anterior is to the top. Otn, optic tectum neuropil. Scale bar = 100 μm. c, d) Forest plots depicting random model meta-analyses of srrm4 morphometry experiments. c) srrm4 G0 crispant experiments and (d) and srrm4 stable mutant experiments. Details of conditions for each experiment are provided in Table 1.