FIGURE SUMMARY
Title

Single-cell profiling and zebrafish avatars reveal LGALS1 as immunomodulating target in glioblastoma

Authors
Finotto, L., Cole, B., Giese, W., Baumann, E., Claeys, A., Vanmechelen, M., Decraene, B., Derweduwe, M., Dubroja Lakic, N., Shankar, G., Nagathihalli Kantharaju, M., Albrecht, J.P., Geudens, I., Stanchi, F., Ligon, K.L., Boeckx, B., Lambrechts, D., Harrington, K., Van Den Bosch, L., De Vleeschouwer, S., De Smet, F., Gerhardt, H.
Source
Full text @ EMBO Mol. Med.

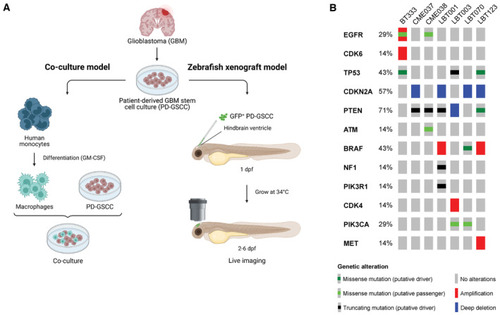
Overview experimental set‐up and included GSCCs

Schematic overview of the study design. Eight different GSCCs were used in a co‐culture model with human monocyte‐derived macrophages (left) and in an orthotopic zebrafish xenograft model (right). dpf, days post fertilization.

Oncoprint of included GSCCs: broad spectrum of common genetic aberrations in GBM were covered. Included GSCCs are mentioned on top of the figure.

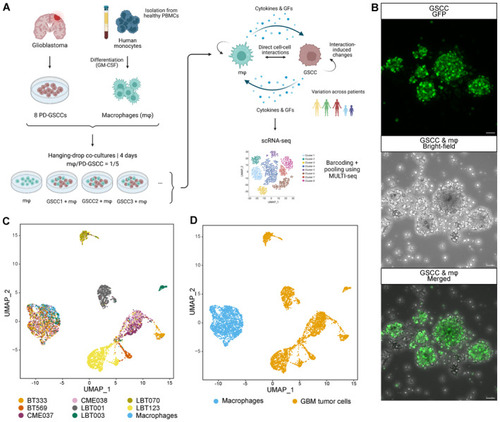
Single‐cell profiling of GSCC‐macrophage co‐cultures

Schematic overview of the experimental set‐up of the scRNA‐seq profiling assay. PBMCs, peripheral blood mononuclear cells; GFs, growth factors.

High‐resolution images of a GSCC‐macrophage co‐culture. GFP+ GSCC was used for visualization of the co‐culture with non‐labeled macrophages. Scale bars: 50 μm.

Uniform Manifold Approximation and Projection (UMAP) plots of 5,320 cells from nine samples, annotated by sample name (C) and by cell type (D).

Source data are available online for this figure.

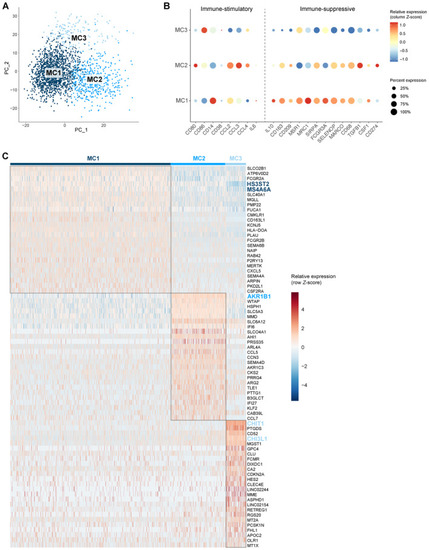
Molecular heterogeneity of GBM‐associated macrophages

Principal component analysis (PCA) plot of macrophage population identified three distinct macrophage subclusters (MC1‐3). PCs were calculated using the 2,000 most variable genes. Plot shows PC1 and PC2.

Dot plot showing marker gene expression for immune‐stimulation and ‐suppression. Dot size indicates the percentage of cells in each macrophage subcluster expressing the gene, and dot color indicates the relative expression level.

Heatmap of top 25 differentially expressed genes in the macrophage subclusters, ranked by log2(FC). Genes discussed in the text are highlighted in the subcluster colors.

Source data are available online for this figure.

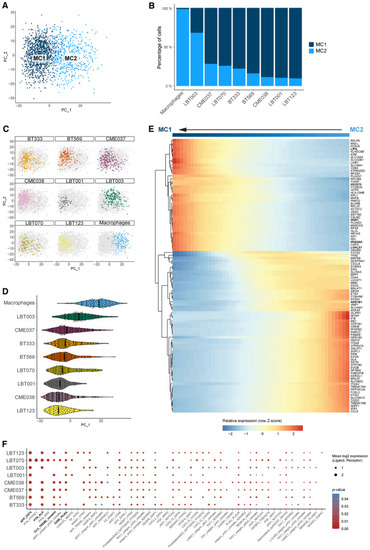
Macrophages shift toward an immunosuppressive phenotype upon co‐culture with patient‐derived GSCCs

PCA plot of macrophage population without TransMos shows two distinct macrophage subclusters (MC1‐2). PCs were calculated using the 2,000 most variable genes. PC1 and PC2 are shown on the PCA plot.

Macrophage subcluster distribution for the different samples.

Representation of original samples on the PCA plot.

Pseudotime analysis along PC1 axis. Violin plots depicting the PC1 values of each single cell, split up by sample.

Heatmap of the 100 most significant temporally expressed genes along the PC1 axis, constructed by fitting a generalized additive model with the PC1 value as a LOESS term (see Materials and Methods).

Dot plot of cell–cell communication analysis using CellPhoneDB. Depicted are L:R pairs for GSCC ‐ macrophage signaling across all GSCCs, ranked by mean log2 expression. Each dot size shows the log2 mean of expression values and dot color indicates the P‐value for the listed L:R pairs (x‐axis) in the respective GSCCs (y‐axis). Only top 50 significant L:R pairs, with cut‐offs of P‐value ≦ 0.05 are shown. The P‐values were generated by CellPhoneDB, which uses a one‐sided permutation test to compute significant interactions.

Source data are available online for this figure.

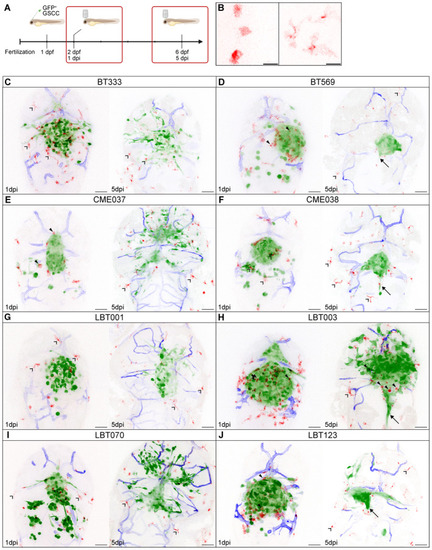
Overview of different zebrafish avatars

Schematic overview showing the timeline of the orthotopic zebrafish xenograft model.

Zoomed‐in images of round (left) and ramified (right) GAMs in the recorded time‐lapse movies. Scale bars: 15 μm.

Representative maximum intensity projections of a z stack of the head region of Tg(mpeg1:mCherryF)ump2; Tg(kdrl:lynEYFP)md77 zebrafish embryos with different GFP‐labeled patient‐derived GSCC tumors, at 1 dpi (left panel) and 5 dpi (right panel): BT333 (C), BT569 (D), CME037 (E), CME038 (F), LBT001 (G), LBT003 (H), LBT070 (I), LBT123 (J). GBM tumor cells are shown in green, GAMs in red, and blood vessels in blue. Arrows indicate midline protrusion of the tumor. Filled arrowheads indicate round GAMs. Open arrowheads indicate ramified GAMs. Scale bars: 50 μm.

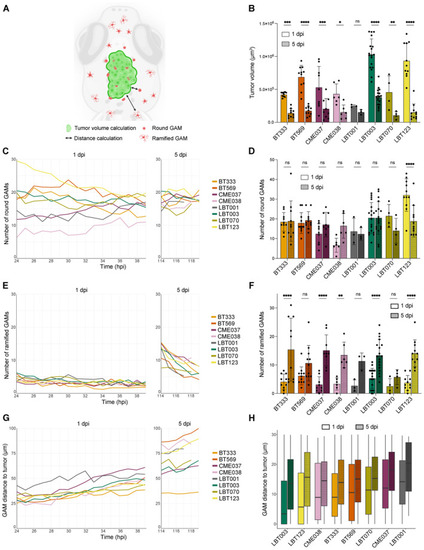
GSCC‐specific morphometrics and dynamics of the tumor and its microenvironment in 3D over time

Schematic overview of features extracted and computed from the time‐lapse movies of the orthotopic zebrafish xenograft model.

Tumor volume at the start of 1 and 5 dpi time‐lapse movies (n = 10 (BT333), 11 (BT569), 9 (CME037), 6 (CME038), 3 (LBT001), 18 (LBT003), 4 (LBT070), 11 (LBT123) zebrafish embryos; P = 0.0005 (BT333), 1.2e‐10 (BT569), 0.0001 (CME037), 0.0147 (CME038), 0.9905 (LBT001), < 1.0e‐15 (LBT003), 0.0099 (LBT070), < 1.0e‐15 (LBT123)).

Mean number of round GAMs over time, during 1 dpi movies (left) and 5 dpi movies (right) (n = 10 (BT333), 12 and 11 (BT569; 1 and 5 dpi), 10 and 9 (CME037; 1 and 5 dpi), 6 (CME038), 8 and 4 (LBT001; 1 and 5 dpi), 22 and 18 (LBT003; 1 and 5 dpi), 12 and 9 (LBT070; 1 and 5 dpi), 15 and 11 (LBT123; 1 and 5 dpi) zebrafish embryos, see also Fig EV3A).

Number of round GAMs at the start of 1 and 5 dpi time‐lapse movies (n = 10 (BT333), 11 (BT569), 9 (CME037), 6 (CME038), 3 (LBT001), 18 (LBT003), 4 (LBT070), 11 (LBT123) zebrafish embryos; P = 1.0000 (BT333), 0.9996 (BT569), 0.6715 (CME037), 0.0804 (CME038), 1.0000 (LBT001), 1.0000 (LBT003), 0.5888 (LBT070), 7.3e‐5 (LBT123)).

Mean number of ramified GAMs over time, during 1 dpi movies (left) and 5 dpi movies (right) (n = 10 (BT333), 12 and 11 (BT569; 1 and 5 dpi), 10 and 9 (CME037; 1 and 5 dpi), 6 (CME038), 8 and 4 (LBT001; 1 and 5 dpi), 22 and 18 (LBT003; 1 and 5 dpi), 12 and 9 (LBT070; 1 and 5 dpi), 15 and 11 (LBT123; 1 and 5 dpi) zebrafish embryos, see also Fig EV3A).

Number of ramified GAMs at the start of 1 and 5 dpi time‐lapse movies (n = 10 (BT333), 11 (BT569), 9 (CME037), 6 (CME038), 3 (LBT001), 18 (LBT003), 4 (LBT070), 11 (LBT123) zebrafish embryos; P = 4.7e‐5 (BT333), 0.3089 (BT569), 4.1e‐5 (CME037), 0.0081 (CME038), 0.2899 (LBT001), 9.2e‐5 (LBT003), 0.9758 (LBT070), 9.4e‐5 (LBT123)).

Mean GAM distance to the tumor over time, during 1 dpi movies (left) and 5 dpi movies (right) (n = 388 and 494 (BT333; 1 and 5 dpi), 503 and 471 (BT569; 1 and 5 dpi), 234 and 455 (CME037; 1 and 5 dpi), 107 and 251 (CME038; 1 and 5 dpi), 226 and 169 (LBT001; 1 and 5 dpi), 945 and 934 (LBT003; 1 and 5 dpi), 453 and 338 (LBT070; 1 and 5 dpi), 774 and 543 (LBT123; 1 and 5 dpi) GAMs).

Boxplot of GAM distance to the tumor of all GAMs within 30 μm of the tumor, at the start of 1 and 5 dpi time‐lapse movies, ranked by increasing median distance at 1 dpi (n = 634 and 302 (LBT003; 1 and 5 dpi), 458 and 115 (LBT123; 1 and 5 dpi), 66 and 48 (CME038; 1 and 5 dpi), 267 and 264 (BT333; 1 and 5 dpi), 309 and 98 (BT569; 1 and 5 dpi), 257 and 99 (LBT070; 1 and 5 dpi), 134 and 142 (CME037; 1 and 5 dpi), 109 and 26 (LBT001; 1 and 5 dpi) GAMs; boxes stand for 50% of the data and minima/maxima are indicated by the line ends).

Data information: Data describe biological replicates, i.e. individual zebrafish embryos. The xenograft experiment was replicated once for CME038, twice for BT333, BT569, CME037, LBT001, three times for LBT070 and LBT123, and four times for LBT003. In (B, D and F), data are presented as mean ± SD. The P‐values were calculated by two‐way repeated measures ANOVA, followed by Šídák's multiple comparisons correction. ns ≥ 0.05, *P < 0.05, **P < 0.01, ***P < 0.001, ****P < 0.0001.

Source data are available online for this figure.

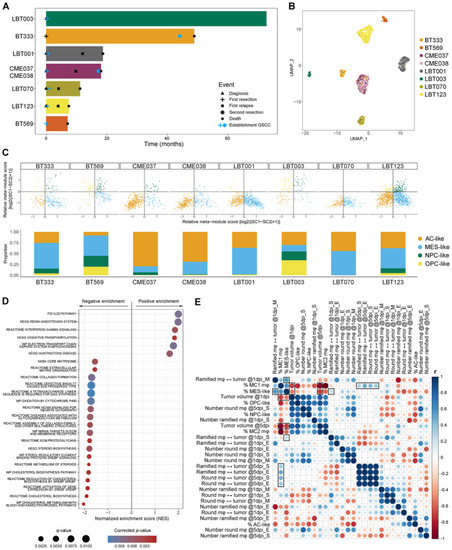
Macrophage/GAM‐GSCC interactions correlate to clinical outcome in GBM patients

Swimmer plot of included patients with indication of important events.

UMAP plot of GBM tumor cells annotated by sample name.

Two‐dimensional butterfly plot visualization of molecular subtype signature scores according to Neftel et al (2019) (top). Each quadrant corresponds to a subtype, and the position of each cell reflects its relative signature scores. Colors represent different clusters. Neftel cluster distribution for the different samples (bottom).

Dot plot showing the 25 most significant positive and negative enriched GSEA pathways using all curated gene sets of WikiPathways, Reactome, KEGG, PID and BioCarta databases for the group of invasive GSCCs (cut‐off corrected P‐value = 0.05).

Correlogram of in vitro and in vivo data of the GSCCs (n = 8). Dot size and color indicate the Pearson correlation coefficient (r). mφ, macrophages/GAMs; ↔, distance to; S, start (24–26 or 114–116 hpi); M, mid (30–32 hpi); E, end (37–39 or 117–119 hpi) indicate timepoints of the time‐lapse movies.

Source data are available online for this figure.

LGALS1 is involved in suppression of the immune system

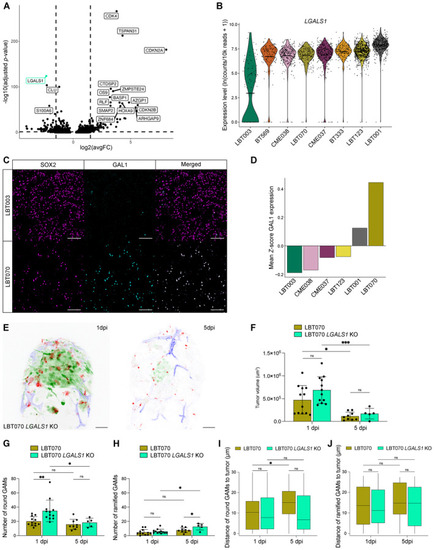
Volcano plot depicting differentially expressed genes in LBT003 and all other GSCCs (Left: downregulated genes in LBT003; right: upregulated genes in LBT003). y‐axis denotes −log10(adjusted P‐value) while x‐axis shows log2(avgFC) values. Cut‐offs were set at −log10(adjusted P‐value) > 1.3 and abs(log2(avgFC)) > 1.5.

Violin plot showing LGALS1 expression levels in GSCCs.

Representative double immunofluorescence images showing co‐expression of SOX2 (magenta) and GAL1 (cyan) in GBM tissue from LBT003 and LBT070. For enhanced visualization, a binary mask was generated from the SOX2+ cells and multiplied with the image of GAL1 staining in Fiji to exclude GAL1 staining in non‐tumor cells. Scale bars: 100 μm.

Mean fluorescence intensity values for GAL1 staining in SOX2+ cells in GBM tissue samples, normalized using Z‐scores within each sample. n = 6 tumor samples derived from five different patients.

Representative maximum intensity projections of a z stack of the head region of a Tg(mpeg1:mCherryF)ump2; Tg(kdrl:lynEYFP)md77 zebrafish embryo with a GFP‐labeled LBT070 LGALS1 KO tumor, at 1 dpi (left panel) and 5 dpi (right panel). Corresponding control images: see Fig 5I. GBM tumor cells are shown in green, GAMs in red, and blood vessels in blue. Scale bars: 50 μm.

Tumor volume at the start of 1 and 5 dpi time‐lapse movies (n = 12 and 9 (LBT070; 1 and 5 dpi), 12 and 5 (LBT070 LGALS1 KO; 1 and 5 dpi) zebrafish embryos; P = 0.0118 (LBT070), 0.0008 (LBT070 LGALS1 KO), 0.0927 (1 dpi), 0.9320 (5 dpi)).

Number of round GAMs at the start of 1 and 5 dpi time‐lapse movies (n = 12 and 9 (LBT070; 1 and 5 dpi), 12 and 5 (LBT070 LGALS1 KO; 1 and 5 dpi) zebrafish embryos; P = 0.1240 (LBT070), 0.0144 (LBT070 LGALS1 KO), 0.0053 (1 dpi), 0.1174 (5 dpi)).

Number of ramified GAMs at the start of 1 and 5 dpi time‐lapse movies (n = 12 and 9 (LBT070; 1 and 5 dpi), 12 and 5 (LBT070 LGALS1 KO; 1 and 5 dpi) zebrafish embryos; P = 0.1816 (LBT070), 0.0187 (LBT070 LGALS1 KO), 0.6851 (1 dpi), 0.0497 (5 dpi)).

Boxplot of GAM distance to the tumor of round GAMs within 30 μm of the tumor, at the start of 1 and 5 dpi time‐lapse movies (n = 137 and 48 (LBT070; 1 and 5 dpi), 291 and 39 (LBT070 LGALS1 KO; 1 and 5 dpi) GAMs; P = 0.0119 (LBT070), 0.9984 (LBT070 LGALS1 KO), 0.9999 (1 dpi), 0.0531 (5 dpi); boxes stand for 50% of the data and minima/maxima are indicated by the line ends).

Boxplot of GAM distance to the tumor of ramified GAMs within 30 μm of the tumor, at the start of 1 and 5 dpi time‐lapse movies (n = 29 and 13 (LBT070; 1 and 5 dpi), 40 and 20 (LBT070 LGALS1 KO; 1 and 5 dpi) GAMs; P = 0.8012 (LBT070), 0.9647 (LBT070 LGALS1 KO), 1.0000 (1 dpi), 0.9675 (5 dpi); boxes stand for 50% of the data and minima/maxima are indicated by the line ends).

Data information: The zebrafish experiments describe biological replicates, i.e. individual zebrafish embryos. The xenograft experiment was replicated twice for LBT070 LGALS1 KO, and three times for LBT070. In (F–H), data are presented as mean ± SD, and the P‐values were calculated by mixed‐effects model, followed by Šídák's multiple comparisons correction. In (I and J), the P‐values were calculated by two‐way ANOVA, followed by pairwise testing with Tukey's multiple comparisons correction. ns ≥ 0.05, *P < 0.05, **P < 0.01, ***P < 0.001.

Source data are available online for this figure.

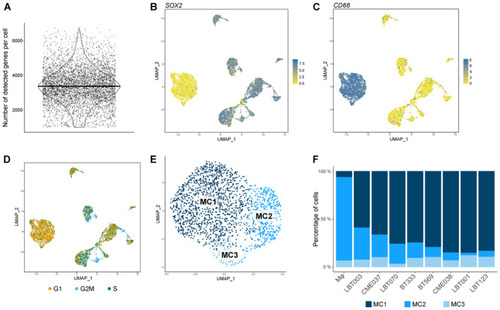
Single‐cell profiling of GSCC‐macrophage co‐cultures reveals molecular heterogeneity of GBM‐associated macrophages

Violin plot showing the number of detected genes per cell (n = 5,320 cells from nine samples with a median of 3,334 genes detected per cell).

UMAP plots showing SOX2 (B) and CD68 (C) expression.

UMAP plot showing cell cycle score. Proliferating GBM tumor cells are depicted in blue.

UMAP plot of macrophage population identified three distinct macrophage subclusters (MC1‐3).

Macrophage subcluster distribution for the different samples. mφ, macrophages.

Source data are available online for this figure.

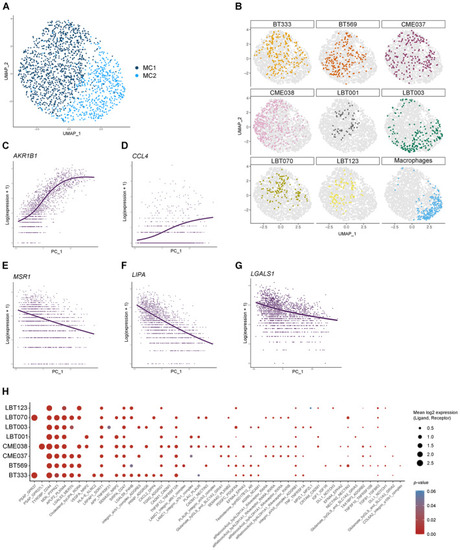
Macrophages shift toward an immunosuppressive phenotype upon co‐culture with patient‐derived GSCCs

UMAP plot of macrophage population without TransMos shows two distinct macrophage subclusters (MC1‐2).

Representation of original samples on the UMAP plot.

LOESS plots for AKR1B1 (C), CCL4 (D), MSR1 (E), LIPA (F), and LGALS1 (G).

Dot plot of cell–cell communication analysis using CellPhoneDB. Depicted are L:R pairs for macrophage ‐ GSCC signaling across all GSCCs, ranked by mean log2 expression. Each dot size shows the log2 mean of expression values and dot color indicates the P‐value for the listed L:R pairs (x‐axis) in the respective GSCCs (y‐axis). Only top 50 significant L:R pairs, with cut‐offs of P‐value ≦ 0.05 are shown. The P‐values were generated by CellPhoneDB, which uses a one‐sided permutation test to compute significant interactions.

Source data are available online for this figure.

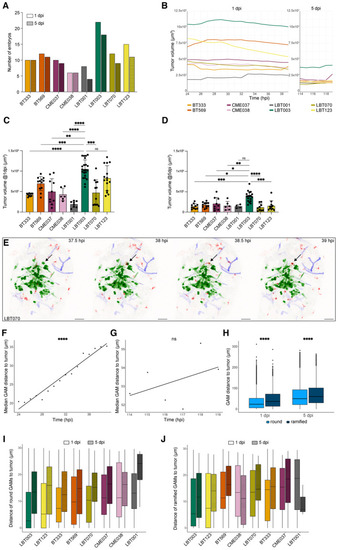
GSCC‐specific morphometrics and dynamics of the tumor and its microenvironment in 3D over time

Number of zebrafish embryos used for the time‐lapse movies that were generated at 1 and 5 dpi.

Mean tumor volume over time, during 1 dpi movies (left) and 5 dpi movies (right) (n = 10 (BT333), 12 and 11 (BT569; 1 and 5 dpi), 10 and 9 (CME037; 1 and 5 dpi), 6 (CME038), 8 and 4 (LBT001; 1 and 5 dpi), 22 and 18 (LBT003; 1 and 5 dpi), 12 and 9 (LBT070; 1 and 5 dpi), 15 and 11 (LBT123; 1 and 5 dpi) zebrafish embryos, see also panel A).

Tumor volume at the start of 1 dpi time‐lapse movies (n = 10 (BT333), 12 (BT569), 10 (CME037), 6 (CME038), 8 (LBT001), 22 (LBT003), 12 (LBT070), 15 (LBT123); P = < 1.0e‐15 (BT333), 0.0001 (BT569), 0.0017 (CME037), 3.1e‐5 (CME038), < 1.0e‐15 (LBT001), 0.0002 (LBT070), 0.1542 (LBT123)).

Tumor volume at the start of 5 dpi time‐lapse movies (n = 10 (BT333), 11 (BT569), 9 (CME037), 6 (CME038), 4 (LBT001), 18 (LBT003), 9 (LBT070), 11 (LBT123); P = 0.0009 (BT333), 0.0179 (BT569), 0.0237 (CME037), 0.0095 (CME038), 0.0538 (LBT001), 4.7e‐5 (LBT070), 0.0003 (LBT123)).

Representative maximum intensity projections of a z stack of the head region of a Tg(mpeg1:mCherryF)ump2; Tg(kdrl:lynEYFP)md77 zebrafish embryo with a GFP‐labeled LBT070 tumor, at 37.5, 38, 38.5 and 39 hpi to illustrate phagocytosis of a GBM tumor cell by a round GAM (indicated by arrows). GBM tumor cells are shown in green, GAMs in red, and blood vessels in blue. Scale bars: 50 μm.

Trend line of median GAM distance to the tumor over time in 1 dpi (F) and 5 dpi (G) movies for all GSCCs (n = 43,857 (F) and 16,639 (G) GAMs; P = 6.0e‐7 (F) and 0.7071 (G)).

Boxplot of distance of round and ramified GAMs to the tumor for all GSCCs, at the start of 1 and 5 dpi time‐lapse movies (n = 1,821 and 1,429 (round; 1 and 5 dpi), 420 and 1,008 (ramified; 1 and 5 dpi) GAMs; P < 6.4e‐7 (1 dpi) and < 2.4e‐5 (5 dpi); boxes stand for 50% of the data and minima/maxima are indicated by the line ends).

Boxplot of GAM distance to the tumor of round GAMs within 30 μm of the tumor, at the start of 1 and 5 dpi time‐lapse movies, ranked by increasing median distance at 1 dpi (n = 325 and 146 (LBT003; 1 and 5 dpi), 273 and 44 (LBT123; 1 and 5 dpi), 134 and 105 (BT333; 1 and 5 dpi), 141 and 49 (BT569; 1 and 5 dpi); 137 and 48 (LBT070; 1 and 5 dpi), 74 and 56 (CME037; 1 and 5 dpi), 26 and 26 (CME038; 1 and 5 dpi), 61 and 11 (LBT001; 1 and 5 dpi); boxes stand for 50% of the data and minima/maxima are indicated by the line ends).

Boxplot of GAM distance to the tumor of ramified GAMs within 30 μm of the tumor, at the start of 1 and 5 dpi time‐lapse movies, ranked by increasing median distance at 1 dpi (n = 63 and 51 (LBT003; 1 and 5 dpi), 26 and 26 (LBT123; 1 and 5 dpi), 38 and 21 (BT569; 1 and 5 dpi), 13 and 12 (CME038; 1 and 5 dpi); 29 and 13 (LBT070; 1 and 5 dpi), 25 and 86 (BT333; 1 and 5 dpi), 18 and 30 (CME037; 1 and 5 dpi), 15 and 3 (LBT001; 1 and 5 dpi); boxes stand for 50% of the data and minima/maxima are indicated by the line ends).

Data information: Data describe biological replicates, i.e. individual zebrafish embryos. The xenograft experiment was replicated once for CME038, twice for BT333, BT569, CME037, LBT001, three times for LBT070 and LBT123, and four times for LBT003. In (C and D), data are presented as mean ± SD. In (C), the P‐values were calculated by Welch's ANOVA test, followed by Dunnett's T3 multiple comparisons correction. In (D), the P‐values were calculated by Kruskal–Wallis test, followed by Dunn's multiple comparisons correction. In (F and G), the P‐values were calculated by the Mann–Kendall trend test. In (H), the P‐values were calculated by Welch's ANOVA test, followed by Games‐Howell's multiple comparisons correction. ns ≥ 0.05, *P < 0.05, **P < 0.01, ***P < 0.001, ****P < 0.0001.

Source data are available online for this figure.

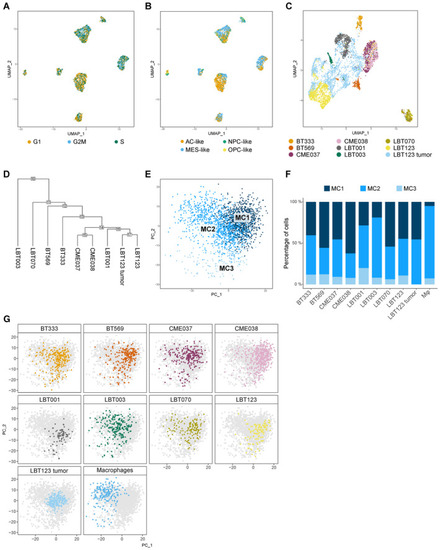
Macrophage/GAM‐GSCC interactions correlate to clinical outcome in GBM patients

UMAP plot of GBM tumor cells showing cell cycle score.

UMAP plot of GBM tumor cells showing Neftel subtypes.

UMAP plot of GBM tumor cells, including cells from the original LBT123 tumor.

Clustering tree of GBM tumor cells. The numbers in the boxes at the nodes indicate the order in which the clusters were merged during the hierarchical clustering process. The internal nodes, which start at the number of leaf nodes + 1, represent the nodes that separate groups at different levels of the hierarchical clustering.

PCA plot of CD68+ cells, including cells from the original LBT123 tumor.

Macrophage/GAM subcluster distribution for the different samples, including cells from the original LBT123 tumor. mφ, macrophages.

Representation of original samples on PCA plot, including the original LBT123 tumor.
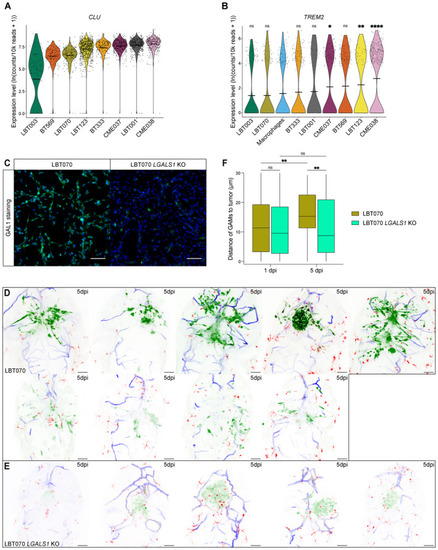
Source data are available online for this figure.

LGALS1 is involved in suppression of the immune system

Violin plot showing CLU expression levels in GSCCs.

Violin plot showing TREM2 expression levels in macrophages (P = 0.8611 (LBT003), 0.5895 (LBT070), 0.3979 (BT333), 0.6995 (LBT001), 0.0122 (CME037), 0.0526 (BT569), 0.0028 (LBT123), 2.8e‐8 (CME038)).

Representative immunofluorescence images of LBT070 LGALS1 WT and LBT070 LGALS1 KO cells showing expression of GAL1 (green), and cell nuclei stained by DAPI. Scale bars: 100 μm.

Maximum intensity projections of a z stack of the head region of Tg(mpeg1:mCherryF)ump2; Tg(kdrl:lynEYFP)md77 zebrafish embryos with GFP‐labeled LBT070 (D) and LBT070 LGALS1 KO (E) tumors at 5 dpi. GBM tumor cells are shown in green, GAMs in red, and blood vessels in blue. Scale bars: 50 μm. n = 9 (D) and 5 (E).

Boxplot of GAM distance to the tumor of all GAMs within 30 μm of the tumor, at the start of 1 and 5 dpi time‐lapse movies (n = 257 and 99 (LBT070; 1 and 5 dpi), 481 and 83 (LBT070 LGALS1 KO; 1 and 5 dpi); P = 0.0020 (LBT070), 0.9997 (LBT070 LGALS1 KO), 0.8013 (1 dpi), 0.0067 (5 dpi); boxes stand for 50% of the data and minima/maxima are indicated by the line ends).

Data information: The zebrafish experiments describe biological replicates, i.e. individual zebrafish embryos. The xenograft experiment was replicated twice for LBT070 LGALS1 KO, and three times for LBT070. In (B), the P‐values were calculated by Kruskal–Wallis test (P = 2.5e‐10). In (F), the P‐values were calculated by two‐way ANOVA, followed by pairwise testing with Tukey's multiple comparisons correction. ns ≥ 0.05, *P < 0.05, **P < 0.01, ****P < 0.0001.

Source data are available online for this figure.

Acknowledgments
This image is the copyrighted work of the attributed author or publisher, and ZFIN has permission only to display this image to its users. Additional permissions should be obtained from the applicable author or publisher of the image. Full text @ EMBO Mol. Med.