
|
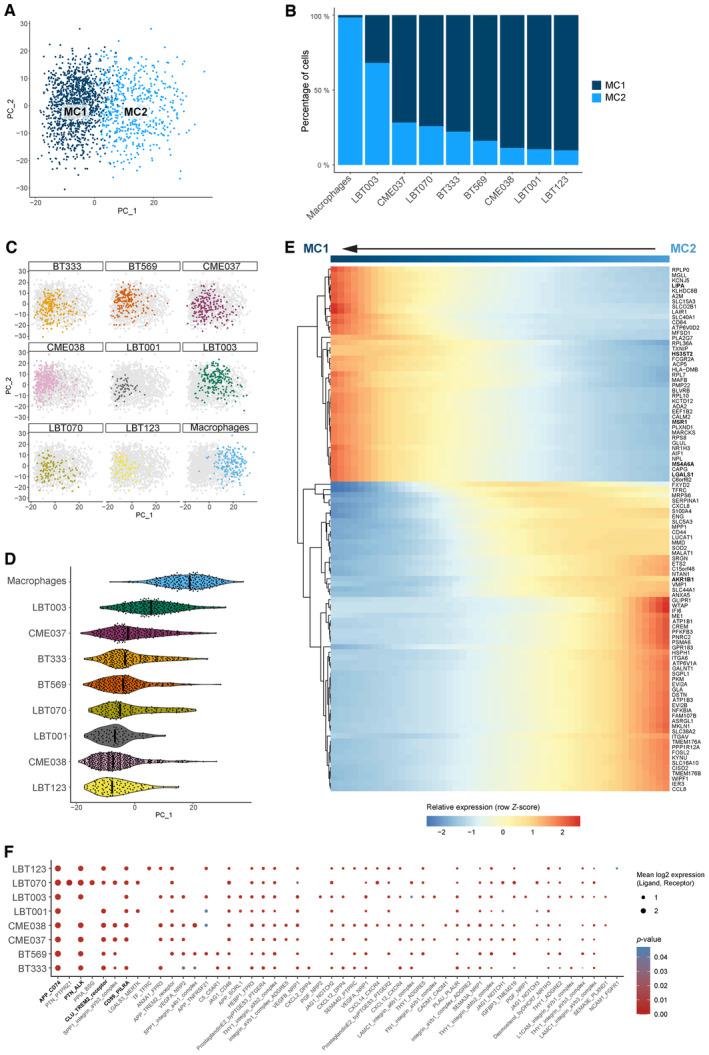
Figure 4 Macrophages shift toward an immunosuppressive phenotype upon co‐culture with patient‐derived GSCCs
PCA plot of macrophage population without TransMos shows two distinct macrophage subclusters (MC1‐2). PCs were calculated using the 2,000 most variable genes. PC1 and PC2 are shown on the PCA plot. Macrophage subcluster distribution for the different samples. Representation of original samples on the PCA plot. Pseudotime analysis along PC1 axis. Violin plots depicting the PC1 values of each single cell, split up by sample. Heatmap of the 100 most significant temporally expressed genes along the PC1 axis, constructed by fitting a generalized additive model with the PC1 value as a LOESS term (see Dot plot of cell–cell communication analysis using CellPhoneDB. Depicted are L:R pairs for GSCC ‐ macrophage signaling across all GSCCs, ranked by mean log2 expression. Each dot size shows the log2 mean of expression values and dot color indicates the