IMAGE

Figure 7

ID
ZDB-IMAGE-231116-145
Source
Figures for Finotto et al., 2023
Image
Figure Caption

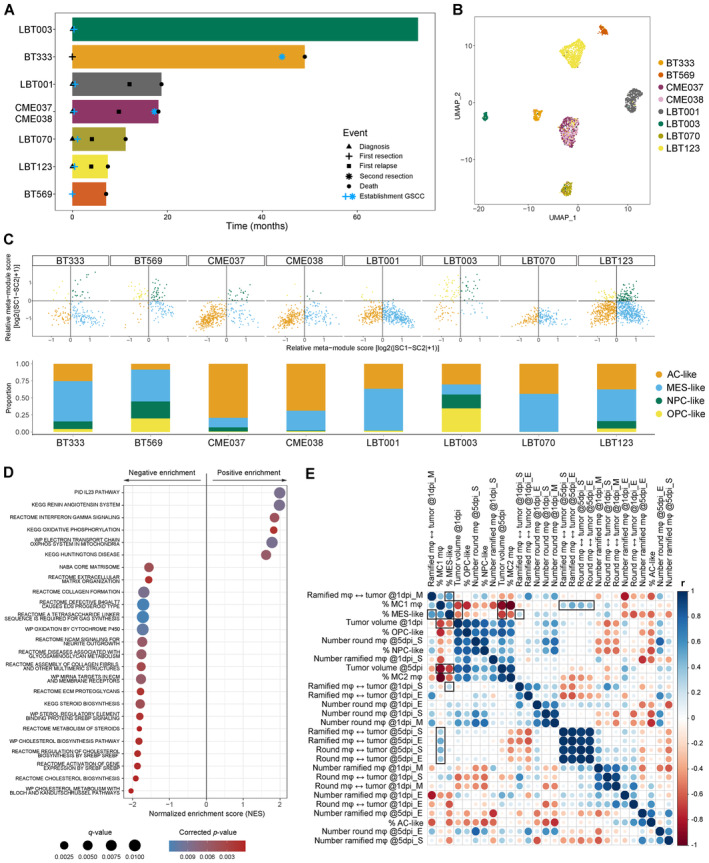
Figure 7 Macrophage/GAM‐GSCC interactions correlate to clinical outcome in GBM patients

Swimmer plot of included patients with indication of important events.

UMAP plot of GBM tumor cells annotated by sample name.

Two‐dimensional butterfly plot visualization of molecular subtype signature scores according to Neftel et al (2019) (top). Each quadrant corresponds to a subtype, and the position of each cell reflects its relative signature scores. Colors represent different clusters. Neftel cluster distribution for the different samples (bottom).

Dot plot showing the 25 most significant positive and negative enriched GSEA pathways using all curated gene sets of WikiPathways, Reactome, KEGG, PID and BioCarta databases for the group of invasive GSCCs (cut‐off corrected P‐value = 0.05).

Correlogram of in vitro and in vivo data of the GSCCs (n = 8). Dot size and color indicate the Pearson correlation coefficient (r). mφ, macrophages/GAMs; ↔, distance to; S, start (24–26 or 114–116 hpi); M, mid (30–32 hpi); E, end (37–39 or 117–119 hpi) indicate timepoints of the time‐lapse movies.

Source data are available online for this figure.

Acknowledgments
This image is the copyrighted work of the attributed author or publisher, and ZFIN has permission only to display this image to its users. Additional permissions should be obtained from the applicable author or publisher of the image. Full text @ EMBO Mol. Med.