
FIGURE
Figure 2
- ID
- ZDB-FIG-231116-128
- Publication
- Finotto et al., 2023 - Single-cell profiling and zebrafish avatars reveal LGALS1 as immunomodulating target in glioblastoma
- Other Figures
- All Figure Page
- Back to All Figure Page
Figure 2
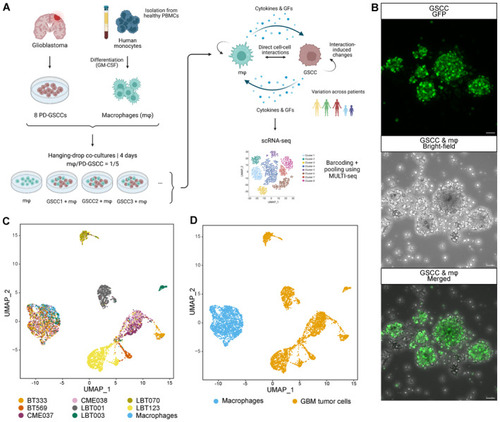
Single‐cell profiling of GSCC‐macrophage co‐cultures Schematic overview of the experimental set‐up of the scRNA‐seq profiling assay. PBMCs, peripheral blood mononuclear cells; GFs, growth factors. High‐resolution images of a GSCC‐macrophage co‐culture. GFP+ GSCC was used for visualization of the co‐culture with non‐labeled macrophages. Scale bars: 50 μm. Uniform Manifold Approximation and Projection (UMAP) plots of 5,320 cells from nine samples, annotated by sample name (C) and by cell type (D). |
Expression Data
Expression Detail
Antibody Labeling
Phenotype Data
Phenotype Detail
Acknowledgments
This image is the copyrighted work of the attributed author or publisher, and
ZFIN has permission only to display this image to its users.
Additional permissions should be obtained from the applicable author or publisher of the image.
Full text @ EMBO Mol. Med.