
FIGURE
Figure EV1
- ID
- ZDB-FIG-231116-129
- Publication
- Finotto et al., 2023 - Single-cell profiling and zebrafish avatars reveal LGALS1 as immunomodulating target in glioblastoma
- Other Figures
- All Figure Page
- Back to All Figure Page
Figure EV1
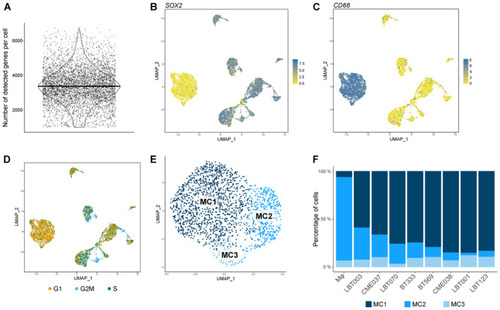
Single‐cell profiling of GSCC‐macrophage co‐cultures reveals molecular heterogeneity of GBM‐associated macrophages Violin plot showing the number of detected genes per cell ( UMAP plots showing UMAP plot showing cell cycle score. Proliferating GBM tumor cells are depicted in blue. UMAP plot of macrophage population identified three distinct macrophage subclusters (MC1‐3). Macrophage subcluster distribution for the different samples. m |
Expression Data
Expression Detail
Antibody Labeling
Phenotype Data
Phenotype Detail
Acknowledgments
This image is the copyrighted work of the attributed author or publisher, and
ZFIN has permission only to display this image to its users.
Additional permissions should be obtained from the applicable author or publisher of the image.
Full text @ EMBO Mol. Med.