
Figure EV2
- ID
- ZDB-FIG-231116-132
- Publication
- Finotto et al., 2023 - Single-cell profiling and zebrafish avatars reveal LGALS1 as immunomodulating target in glioblastoma
- Other Figures
- All Figure Page
- Back to All Figure Page
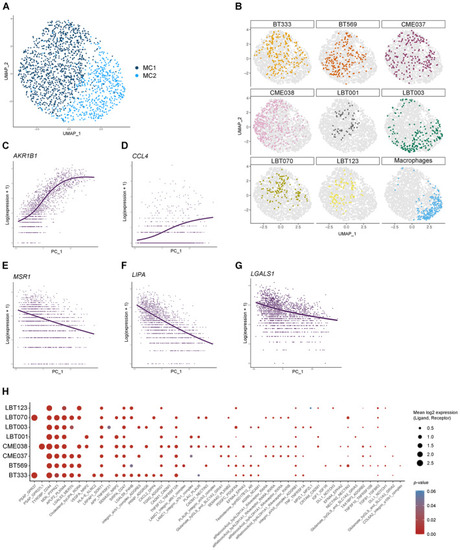
Macrophages shift toward an immunosuppressive phenotype upon co‐culture with patient‐derived GSCCs UMAP plot of macrophage population without TransMos shows two distinct macrophage subclusters (MC1‐2). Representation of original samples on the UMAP plot. LOESS plots for Dot plot of cell–cell communication analysis using CellPhoneDB. Depicted are L:R pairs for macrophage ‐ GSCC signaling across all GSCCs, ranked by mean log2 expression. Each dot size shows the log2 mean of expression values and dot color indicates the |