
Figure 8
- ID
- ZDB-FIG-231116-138
- Publication
- Finotto et al., 2023 - Single-cell profiling and zebrafish avatars reveal LGALS1 as immunomodulating target in glioblastoma
- Other Figures
- All Figure Page
- Back to All Figure Page
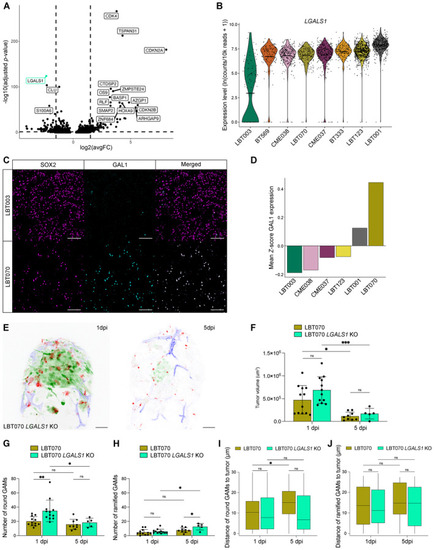
Volcano plot depicting differentially expressed genes in LBT003 and all other GSCCs (Left: downregulated genes in LBT003; right: upregulated genes in LBT003). Violin plot showing Representative double immunofluorescence images showing co‐expression of SOX2 (magenta) and GAL1 (cyan) in GBM tissue from LBT003 and LBT070. For enhanced visualization, a binary mask was generated from the SOX2+ cells and multiplied with the image of GAL1 staining in Fiji to exclude GAL1 staining in non‐tumor cells. Scale bars: 100 μm. Mean fluorescence intensity values for GAL1 staining in SOX2+ cells in GBM tissue samples, normalized using Representative maximum intensity projections of a z stack of the head region of a Tumor volume at the start of 1 and 5 dpi time‐lapse movies ( Number of round GAMs at the start of 1 and 5 dpi time‐lapse movies ( Number of ramified GAMs at the start of 1 and 5 dpi time‐lapse movies ( Boxplot of GAM distance to the tumor of round GAMs within 30 μm of the tumor, at the start of 1 and 5 dpi time‐lapse movies ( Boxplot of GAM distance to the tumor of ramified GAMs within 30 μm of the tumor, at the start of 1 and 5 dpi time‐lapse movies ( Data information: The zebrafish experiments describe biological replicates, i.e. individual zebrafish embryos. The xenograft experiment was replicated twice for LBT070 |