
|
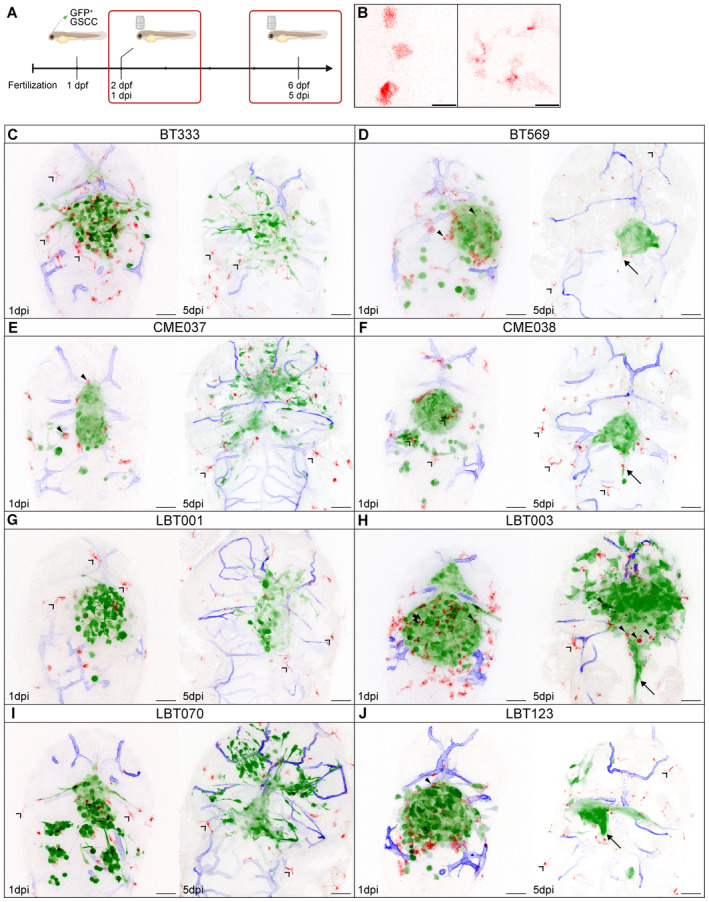
Figure 5 Overview of different zebrafish avatars
Schematic overview showing the timeline of the orthotopic zebrafish xenograft model. Zoomed‐in images of round (left) and ramified (right) GAMs in the recorded time‐lapse movies. Scale bars: 15 μm. Representative maximum intensity projections of a z stack of the head region of